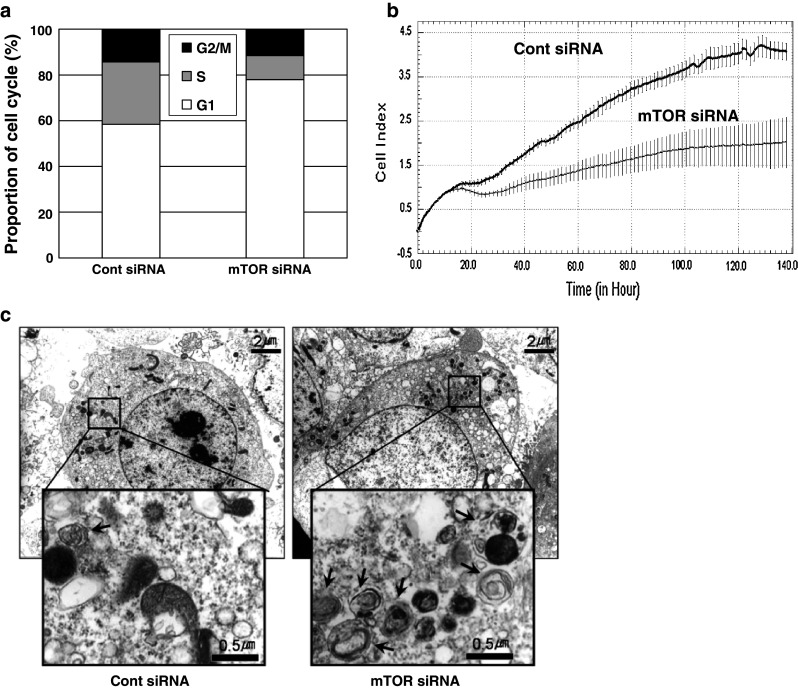
Fig. 5.

Changes in cell growth and autophagy induced by mTOR siRNA treatment. HeLa cells were transfected with siRNAs, as described in Fig. 1a, and analyzed after 48 h. a Cells were fixed in cold ethanol, stained with 0.05 % propidium iodide, and analyzed by flow cytometry with the aid of the CellQuest Program (n = 3). b Cells in 96-well plates were continuously monitored with an xCELLigence real-time cell analyzer system for 140 h (n = 2). Y axis means cell index that represents the properties of cell proliferation and viability. c Cells were prepared for transmission electron microscopy analysis and examined for the presence of autophagic vesicles. Black arrows indicate autophagic vesicles
