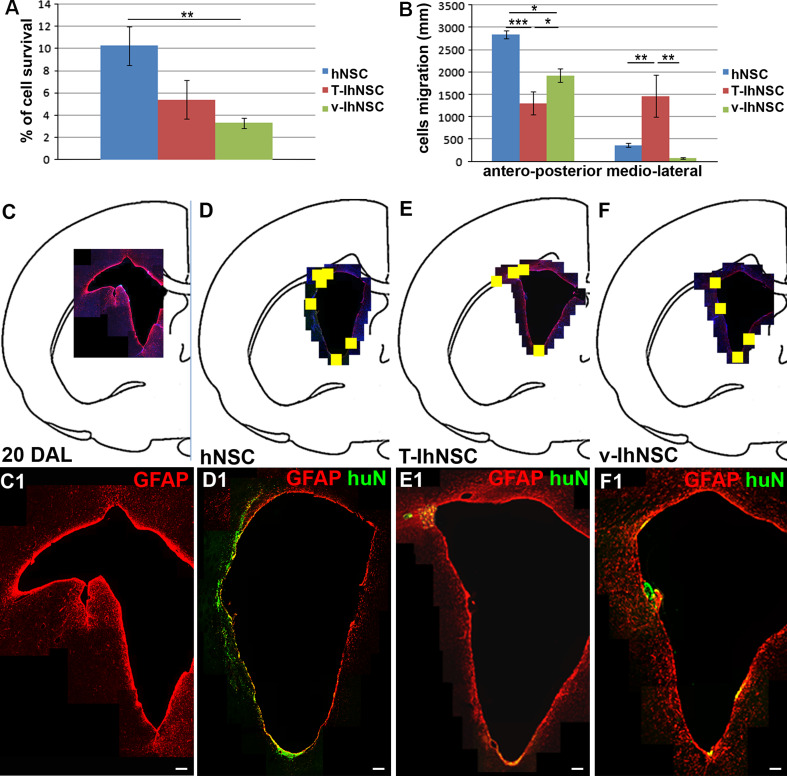
Fig. 2.
Differential distribution of hNSC, T-IhNSC and v-IhNSC into the LPC-lesioned rat brain: quantification of the survival (a) and migration ability (b) of hNSC and IhNSC. c–f Maps showing the activated regions of the SVZ (20 DAL, GFAP+) (c, c1), colonized (yellow square) by transplanted hNSC (d), T-IhNSC (e), and v-IhNSC (f), and respective distribution of huN+ and/or GFAP+ cells in the SVZ (hNSC in d1, T-IhNSC in e1, and v-IhNSC in f1). Scale bars in c1–f1 50 μm

