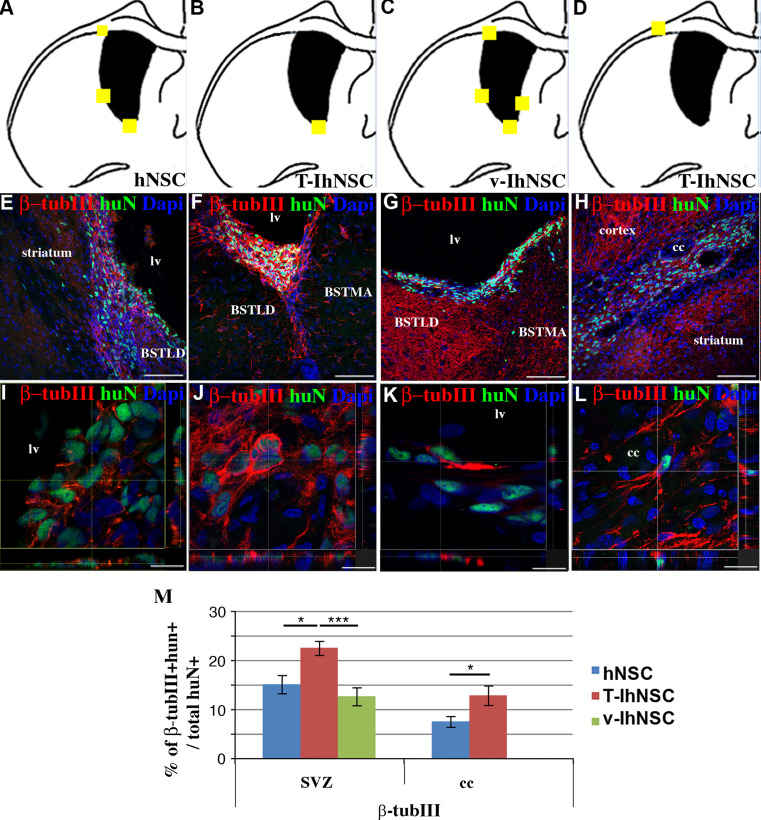
Fig. 5.
Neurons derived from transplanted cells (a–d) brain map showing the localization huN+/β-TubIII+ cells for hNSC (a), T-IhNSC (b, d) and v-IhNSC (c). e–h Distribution of huN+/β-TubIII+ cells into the striatum and SVZ (hNSC in e) or along the SVZ wall (T-IhNSC in f and v-IhNSC in g) or into the cc (T-hNSC in h) i–l confocal microscopy of huN+/β-TubIII in hNSC (i), T-IhNSC (j, l) and v-IhNSC (k). Total nuclei are shown by DAPI staining (blue). m Quantifications of β-TubIII+ cells over total nuclei. BSTMA and BSTLD, respectively, medial and lateral nucleus of stria terminalis, lv lateral ventricle and cc corpus callosum. Scale bars, in e–h 75 μm, in i 10 μm, in j 16.5 μm, in k, l 13 μm

