Fig. 6.
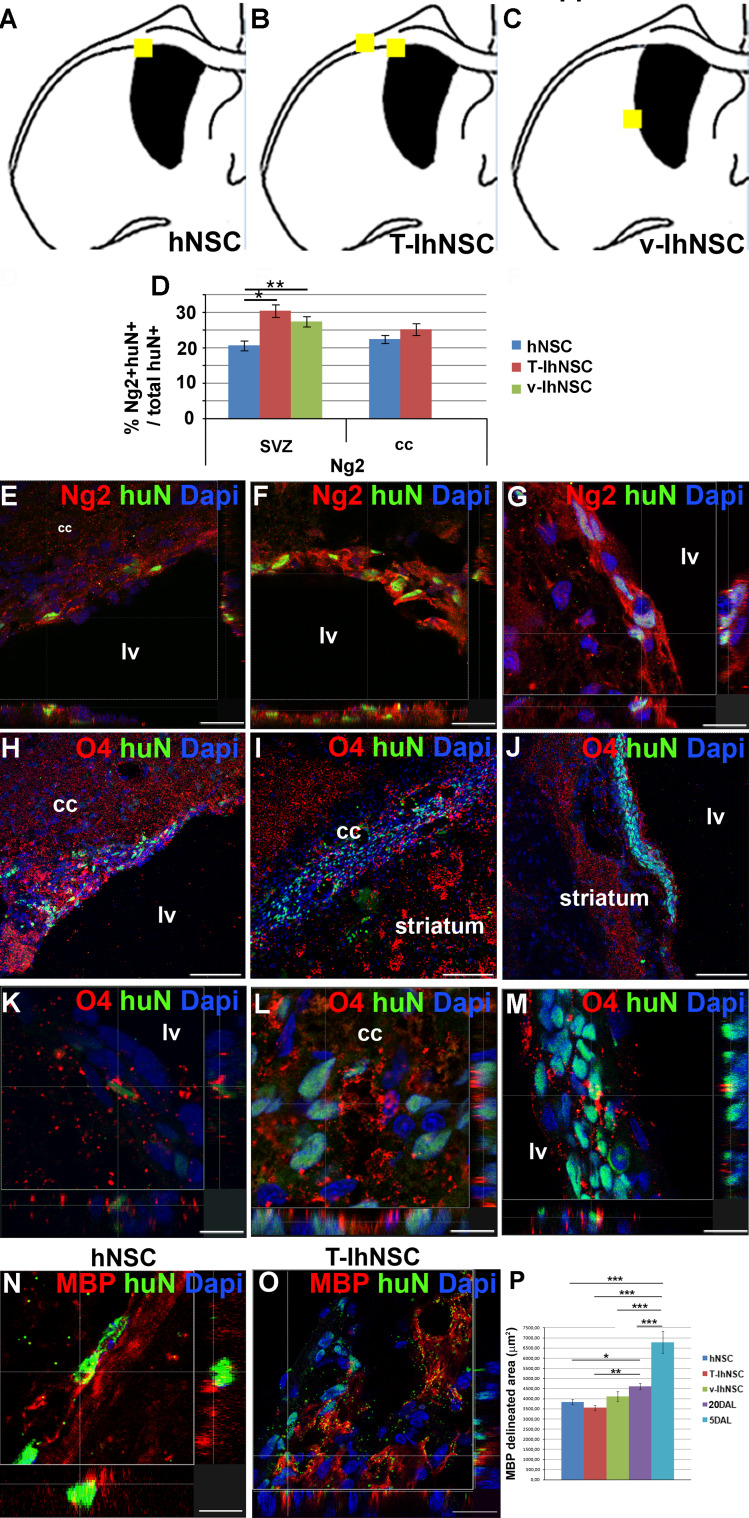
Oligodendrocytes derived from transplanted cells (a–c) brain map showing the localization of huN+ cells co-expressing oligodendrocyte markers Ng2 O4 and/or MBP: hNSC (a), T-IhNSC (b), and v-IhNSC (c). d Quantification of Ng2+ over total huN+ cells. e–g Confocal analysis showing huN+/Ng2+: hNSC (e), T-IhNSC (f), and v-IhNSC (g). h–j huN+/O4+ cells into the cc (hNSC in h; T-IhNSC in i, and their, respectively, confocal magnification in k, l) and into the striatum close to the ventricular wall (v-IhNSC in j, and m confocal magnification). n–o Confocal analysis of huN+/MBP+ cells in cc deriving from hNSC (n) and T-IhNSC (o) at 20 DAL. Total nuclei are shown by DAPI staining (blue). Scale bars, in e, f 22 μm, in h–j 75 μm, in g, k, l, m 11 μm, in o 20 μm and in q 12 μm. lv Lateral ventricle and cc corpus callosum. p Quantification of MBP delineated lesioned area in transplanted and non-transplanted animals (n = 3 per condition)

