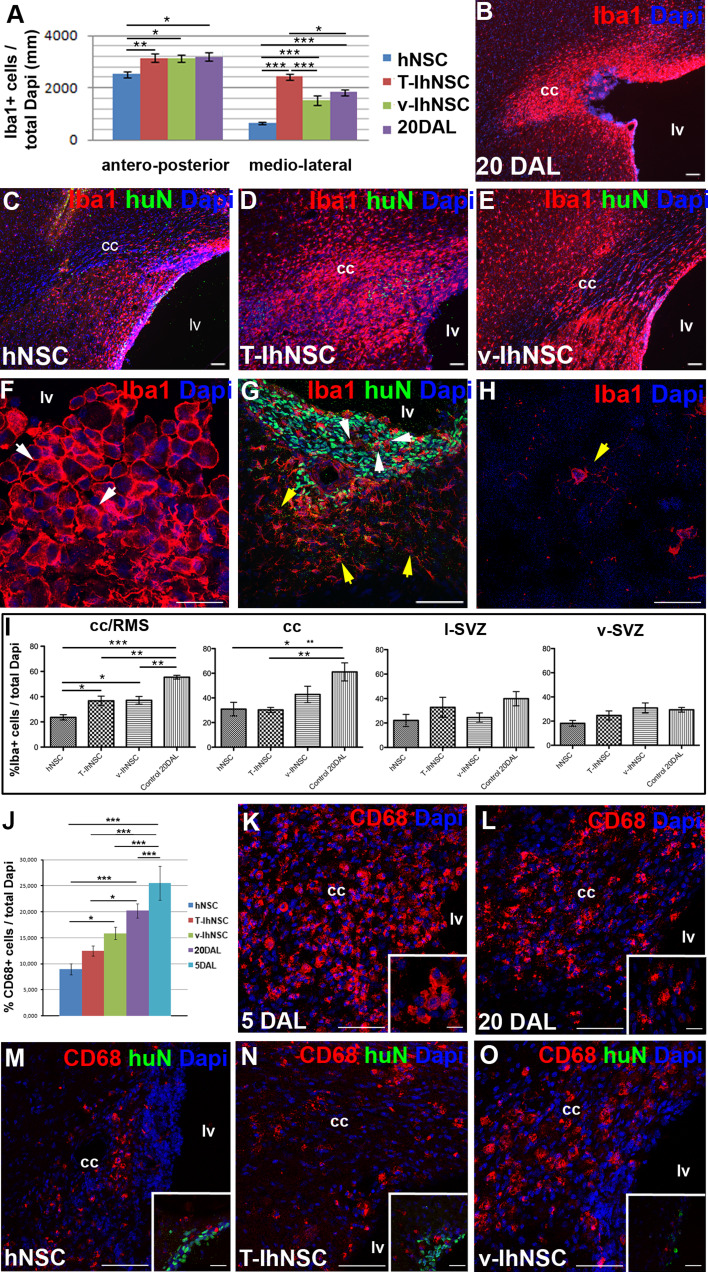
Fig. 7.
Evaluation of activated microglia (a) quantification of the activated microglia extension into the cc of lesioned and transplanted rats. b–e Representative images showing the diverse distribution of activated microglia (Iba1+) in lesioned control rats at 20 DAL (b) or in lesioned animals transplanted with hNSC (c, huN+), T-IhNSC (d, huN+) or v-IhNSC (e, huN+). f–h Microglial morphology in lesioned (f) and transplanted (g) and non-lesioned animals (h). Total nuclei are shown by DAPI staining (blue). i Quantification of Iba1+ cells in cc/RMS, cc lateral sub-ventricular zone l-SVZ, ventral sub-ventricular zone (v-SVZ). j Quantification of CD68+ (red) cells in the cc/RMS of lesioned and transplanted rats. k–o Representative images showing the diverse distribution of activated microglia (CD68+) in lesioned control rats at 5 DAL (k), 20 DAL (l), or in lesioned animals transplanted with hNSC (m, inset huN+ green), T-IhNSC (n, huN+ green) or v-IhNSC (o, huN+ green). Scale bars, in b–e 50 μm, k–o 60 μm, in f–h 21 μm and in g 75 μm, inset k 10 μm, insets l–o 30 μm

