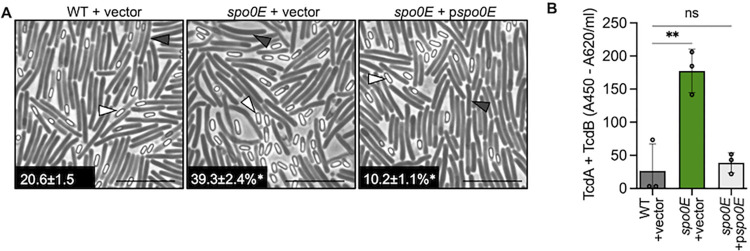
Fig 2. spo0E phenotypes are complemented with reintroduction of spo0E.
A) Representative phase-contrast microscopy and sporulation frequencies of strain 630Δerm + pMC123 (MC324), spo0E + pMC123 (MC1699), and complemented mutant spo0E + pspo0E (MC1698) grown on sporulation agar supplemented with 2 μg ml-1 thiamphenicol for 24 h. n = 4 White triangles indicate phase bright spores, and dark triangles indicate vegetative cells. Scale bar: 10 μm B) Quantification of TcdA and TcdB from supernatants of strain 630Δerm + pMC123 (MC324), spo0E + pMC123 (MC1699), and complemented mutant spo0E + pspo0E (MC1698) in TY supplemented with 2 μg ml-1 thiamphenicol for 24 h. The means and SD of at least three independent experiments are shown and one-way ANOVA with Dunnett’s multiple comparisons test was performed for B-D; *P = <0.05, **P = <0.01.

