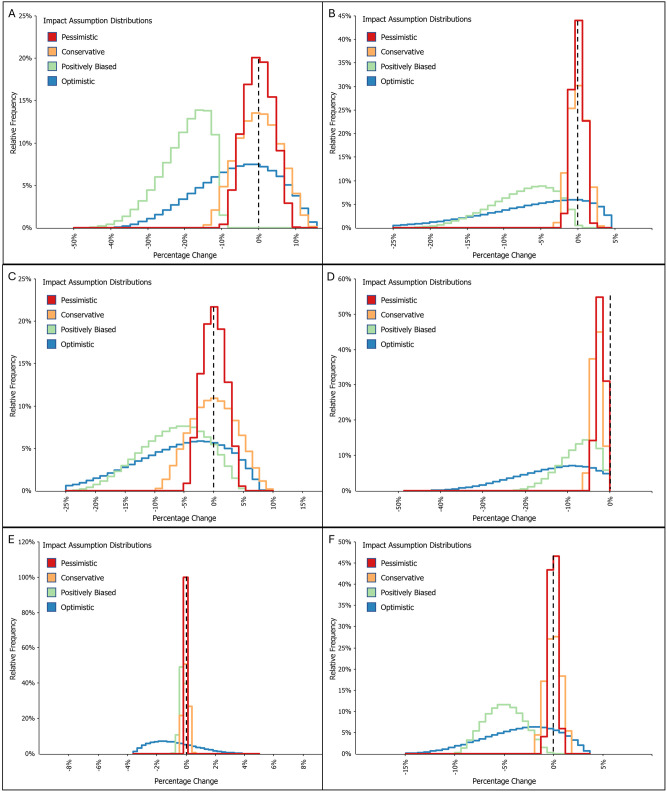
Fig 3. Simulated distributions of impacts assumptions (percentage change) for each cost component a) Suppression costs, variable, b) Suppression costs, fixed, c) Timber losses, d) Property, asset and infrastructure losses, e) Evacuation costs, f) Health costs.
Note that the dashed line within each panel represents a 0% change in cost component value (i.e., the case without WildFireSat).

