FIGURE 3.

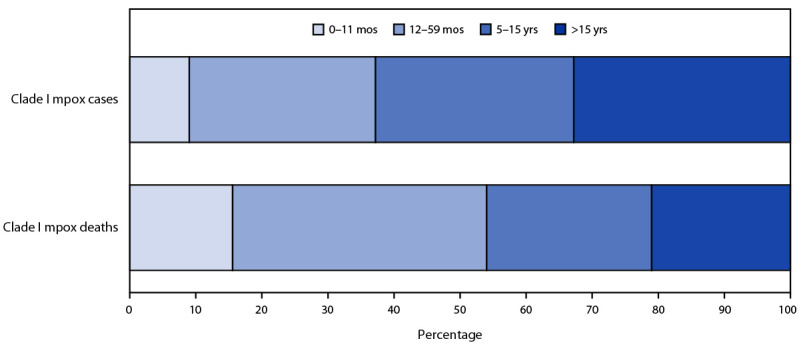
Age distribution of suspected clade I mpox cases and deaths — Democratic Republic of the Congo, January 1, 2023–April 14, 2024

Age distribution of suspected clade I mpox cases and deaths — Democratic Republic of the Congo, January 1, 2023–April 14, 2024