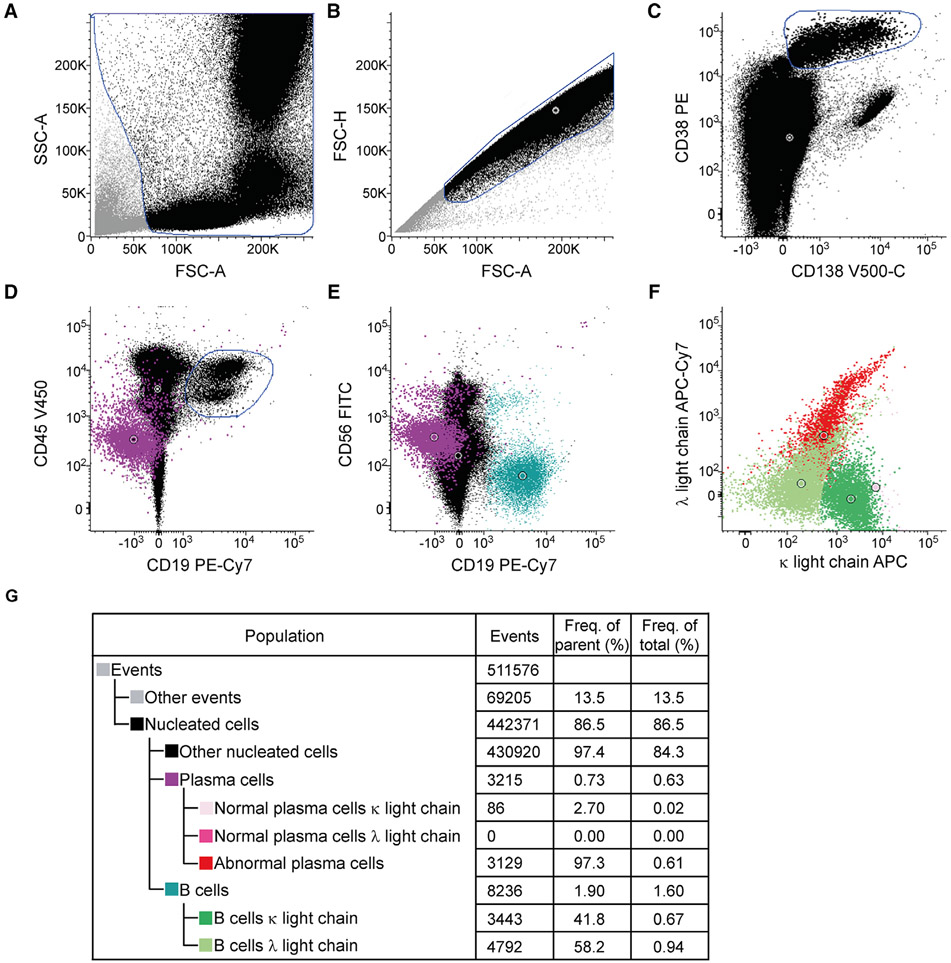
Figure 113.
Identification of aberrant plasma cells in human multiple myeloma bone marrow. (A-C) Plasma cells are defined as the CD38- and CD138-positive population (blue gate shown in Ccorresponds to the purple plasma cell population in D-E) among leukocytes (black) after exclusion of debris (A) and doublets (B). No live/dead staining is performed. Aberrant plasma cells (purple) in this sample are partially CD56-positive, homogeneously negative for CD19 and CD45-low (D-E). Moreover, aberrant plasma cells do show immunoglobulin light chain restriction (in this case lambda, indicated in red, F), which ultimately characterizes them as abnormal plasma cells. As an internal comparison, B cells (gate shown in D) present characteristic CD19 and immunoglobulin kappa and lambda light chain expression. The immunoglobulin light chain expression should be evaluated along a diagonal. B cells typically show lower expression levels of immunoglobulin light chains compared to plasma cells. (F). The hierarchy of defined populations as well as absolute and relative numbers of events are shown in (G). Open circles indicate population centers. Gating was performed with Infinicyt™ Flow Cytometry Software.

