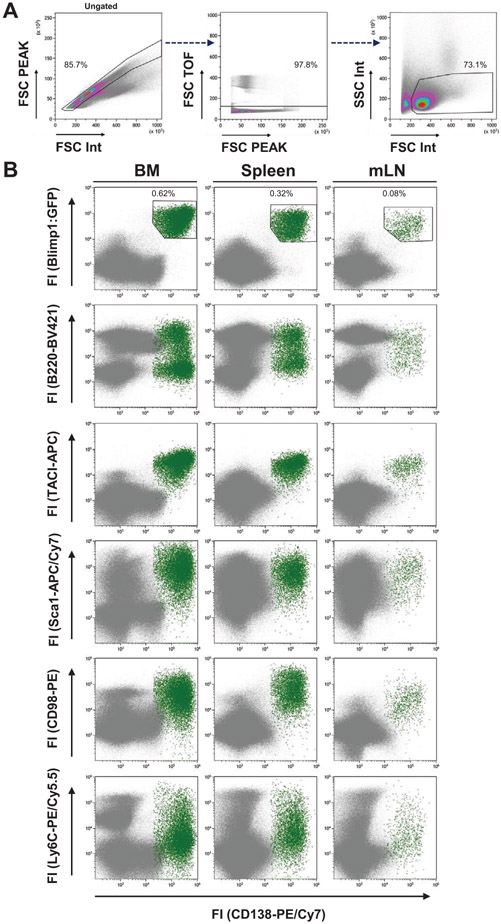
Figure 115.
Comparison of common two-color flow cytometric analyses of murine plasma cell populations. (A) Exemplary gating strategy for single extended lymphocytes in the spleen. Viable cells were defined using FSc/SSc characteristics. (B) Single-cell suspensions from bone marrow (BM), spleen and mesenteric lymph nodes (mLN) of BLIMP1:GFP-reporter mice were isolated and stained as described with Abs against CD138 and one additional surface marker indicated on the y-axis. The input gate for all dot plots in (B) was set to the gate in the rightmost panel described in (A). The BLIMP1:GFPhi/CD138hi gate was used as the reference gate for the plasmablast/plasma cell populations, and events in this gate are highlighted in green in the following plots.

