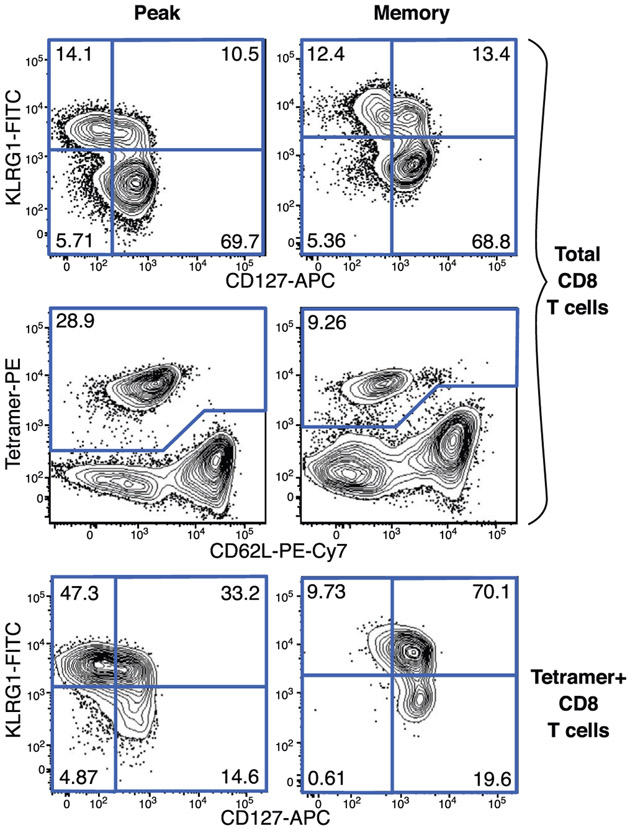
Figure 18.
Delineating murine SLEC and MPEC populations. The expression of KLRG1 and CD127 can be used to differentiate SLECs (KLRG1+CD127−) from MPECs (KLRG1−CD127+). Plots are gated on CD8α+ T cells as in Figure 12 (total CD8 T cells, top two rows) and additionally on tetramer+ cells as in Figure 17 (bottom row). Cells are derived from peripheral blood at the peak (day 27, left) or memory timepoint (day 230, right) post-vaccination with recombinant adenoviral vector (serotype 5) expressing SIV-Gag as a target Ag.

