Figure 4.
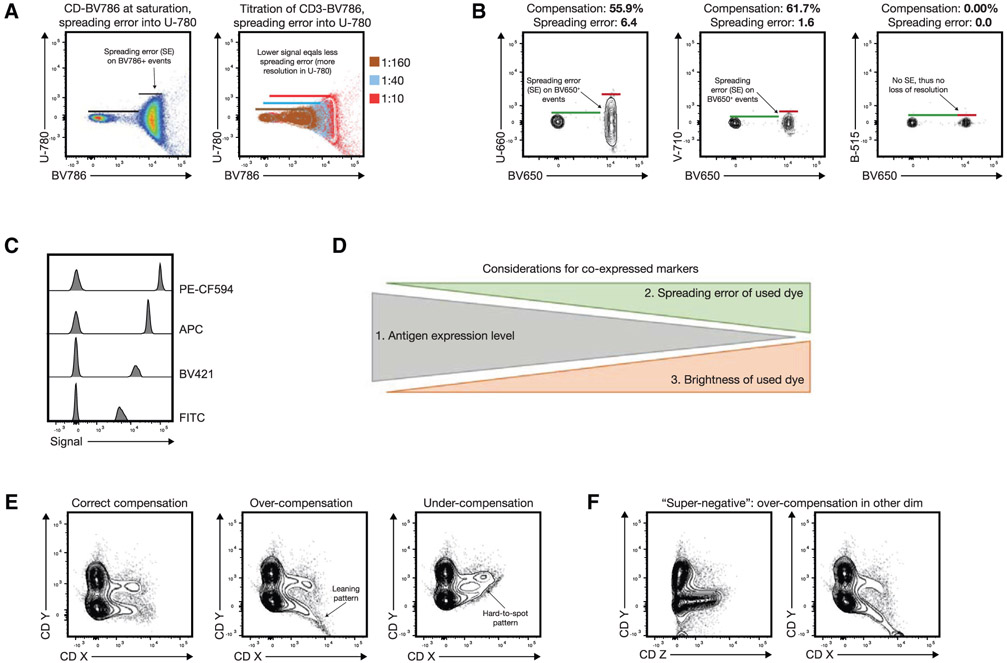
Spreading error and fluorochrome brightness in panel design and common compensation artifacts in quality control. (A) A typical example of spreading error is illustrated: BV786 shows significant spectral overlap in the U-780 detector (excitation by UV laser), which manifests as visible spread of the positive population. The relative loss of resolution on this population compared to the negatives is indicated by black bars on the left plot. Right plot shows how spreading error is proportional to signal intensity, and decreases with lower titers of the respective Ab. (B) The absolute compensation value and spreading error are not directly related, as exemplified for BV650+ events in different detectors (spreading error and compensation values for each combination are displayed above the plot). (C) Examples of staining intensities for different fluorochromes: FITC (dim), BV421 and APC (medium), and PE-CF594 (bright). Note that fluorochrome brightness can be instrument-specific. (D) Overview on the critical considerations for fluorochrome assignment for co-expressed markers. Highly expressed targets should preferably be paired with dim fluorochromes generating little spreading error. Dimly expressed (or unknown) targets should be paired with bright fluorochromes and utilize detectors that receive little spreading error. Numbers 1–3 indicate the relevance of the considerations. (E) and (F) show erroneous patterns that usually indicate incorrectly compensated data: (E) example of a correctly compensated plot, and respective over- and undercompensation of marker CD X into detector for CD Y. (F) Example of an incorrectly compensated population CD X (right plot) appearing as “super-negative” population if displayed against an unrelated detector measuring CD Z (left plot). The erroneous pattern is only visible if displayed against the detector measuring CD Y.

