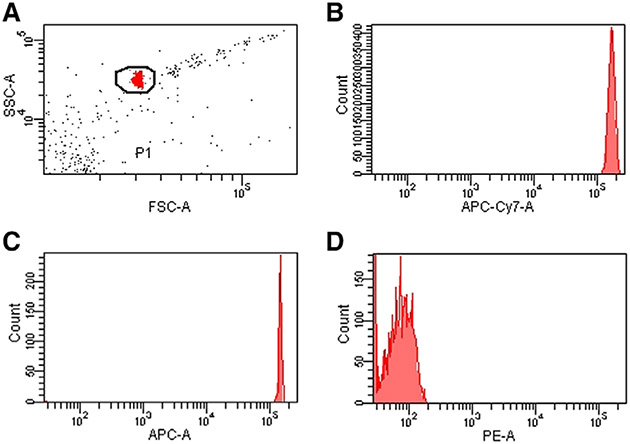
Figure 84.
Flow Cytometer setup for multiplex-beads based array. A. FSC-SSC plot for the identification of beads based on their physical parameters. Histogram plots of APC-Cy7 (B) and ACP (C) channels showing that PMT voltages are optimally set to the highest visible MFI. By this way, it is possible to properly distinguish the different types of beads used. Panel (D) represents histogram plot of PE channel (the fluorochrome bound to the secondary Ab) measured on unstained beads.

