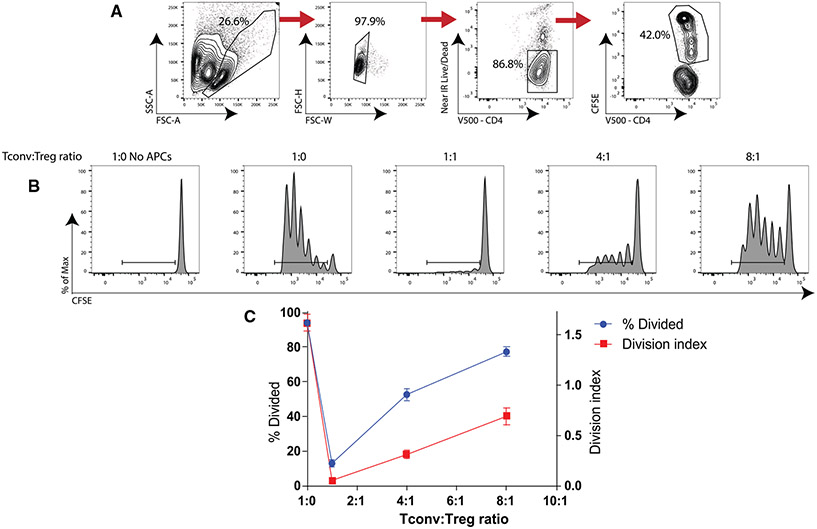
Figure 91.
Analysis of human polyclonal suppression assay. (A) Gating strategy for identification of responder cells in human polyclonal suppression assay. (B) Proliferation histograms of human Tconv cells cultured with various ratios of Treg cells, irradiated CD4− splenocytes, and anti-CD3 for three days. C) Summary data comparing % divided and division index of Tconv cells performed in duplicate. Division index is the average number of divisions by each cell as calculated in FlowJo Software.

