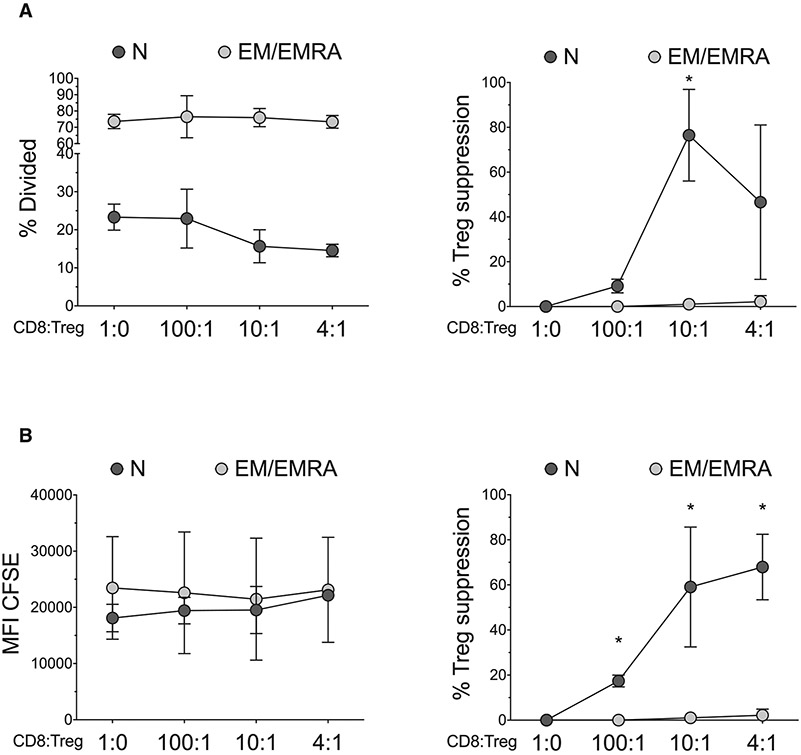
Figure 92.
Analysis of proliferation in human suppression assays of Ag-specific T cells. Comparison between different methods to analyze proliferation in suppression assay of Ag-specific T cells, from human PBMCs, (as described in Figure 4); mean values of four independent experiments are reported. A) Left panel shows % divided of N or EM+EMRA (dextramer+)-CD8+ T cells, at different CD8:Treg ratio. Right panel shows %Treg suppression calculated using % divided T cells (see formula reported in Figure 4C). B) Left panel shows MFI of CFSE of N or EM+EMRA (dextramer+)-CD8+ T cells, at different CD8:Treg ratio. Right panel shows %Treg suppression calculated using MFI of CFSE (see formula reported in Figure 4C). *p < 0.05 one-way ANOVA with Tukey’s multiple comparison test.

