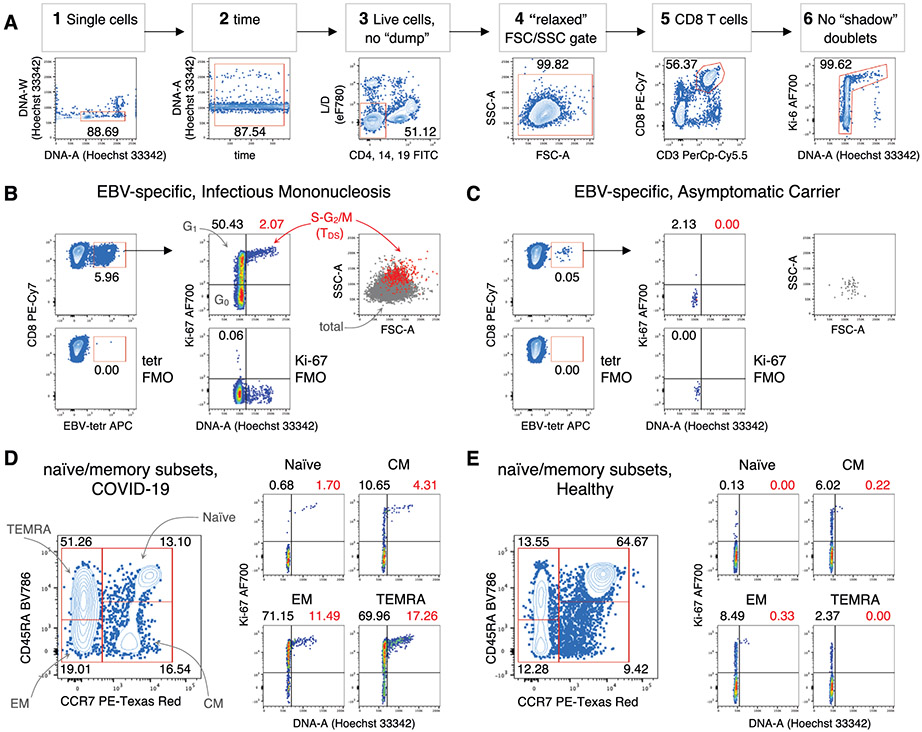
Figure 93.
TDS assay for analysis of human blood CD8 T cells. (A) Gating strategy. Example of viable single CD8 T cell gating in 6 steps: 1) Single cells. Single cells having 2n≤ DNA content ≤4n were selected on the DNA-Area (A) versus (vs) DNA-Width (W) plot; 2) Time. Stable acquisition over time (seconds) was monitored on the time vs DNA-A plot and any events collected in case of pressure fluctuations were excluded; 3) Live cells, no “dump”. CD4+, CD14+, CD19+ cells were excluded on the “dump” channel, and live cells selected using the L/D eF780 dye; 4) “relaxed” FSC/SSC gate. A “relaxed” gate was used on the FSC-A vs SSC-A plot, to include highly activated and cycling lymphocytes [877, 878]; 5) CD8 T cells. CD8 T cells were gated on the CD3 vs CD8 plot. 6) No “shadow” doublets. A few remaining doublets composed by one cell sitting on top of another (so called “shadow” doublets) were excluded as Ki-67int/− events having > 2n DNA content [878]. Numbers indicate cell percentages in the corresponding gate. This gating strategy was used as a base for CD8 T cell analysis. EBV-specific CD8 T cells in Infectious Mononucleosis (B) and Asymptomatic EBV-Carrier (C). Example of CD8/ EBV-tetr plot showing EBV-tetr+ cell gate (top left) and tetr FMO control (bottom left). Cell cycle phases of EBV-tetr+ cells were defined on DNA-A vs Ki-67 plot as follows (top center): cells in G0 were identified as DNA 2n/ Ki67− (bottom left quadrant); cells in G1 as DNA 2n/ Ki-67+ (upper left quadrant); cells in S-G2/M as DNA>2n/ Ki-67+ (TDS cells, top right quadrant). Ki-67 FMO controls are shown (bottom center). Note that the “No shadow doublet” gate (Step 6 in A) cannot be applied to Ki-67 FMO samples. FSC-A/-SSC-A plot (top right), showing TDS cells (in red) overlaid on total EBV-tetr+ cells (in grey). Gating strategy and mAb panel indicated in A. Unpublished data in relation to [878]. Naïve/memory CD8 T cells in COVID-19 patients (D) and Healthy donors (E). The following naïve/memory subsets of CD8 T cells were identified in the CCR7 vs CD45RA plot (left): CD45RA+ CCR7+ naïve, CD45RA− CCR7+ (CM), CD45RA− CCR7− (EM), and CD45RA+ CCR7− TEMRA. Cell cycle phases of each subset were analyzed as in B and C (right). Gating strategy and mAb panel as in A, except for using CD4 BV711 only in “dump” channel (step 3), and CD3 FITC and CD8 PerCp-Cy5.5 (step 5). Unpublished data in relation to [880].

