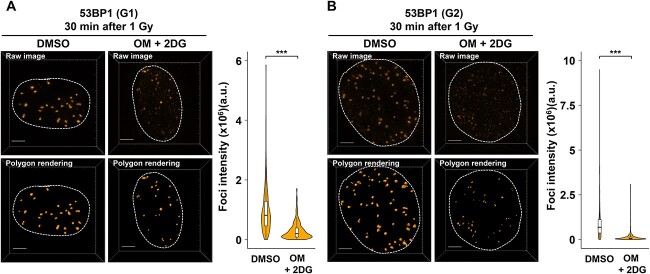
Fig. 3.
Analysis of 53BP1 foci intensity under low ATP conditions. RPE cells were irradiated with 1 Gy IR. DMSO or 10 μM OM + 20 mM 2DG were added 2 h before IR irradiation. For G2 phase foci analysis, 3 μM APH was added immediately after IR. (A) The intensity of 53BP1 foci within γH2AX signal in the G1 phase cells was measured by using Imaris 30 min after IR. Quantified result is shown in right panel. (B) The intensity of 53BP1 foci within γH2AX signal in the G2 phase cells was measured by using Imaris 30 min after IR. In both (A) and (B), images were captured using a DeltaVision OMX. Polygon rendering was generated using Imaris as representative images. Quantified result is shown in right panel. Similar results were obtained in two independent experiments. Scale bar, 3 μm. The number of analyzed foci (DMSO: n = 307, OM + 2DG: n = 289, for G1; DMSO: n = 564, OM + 2DG: n = 623, for G2).

