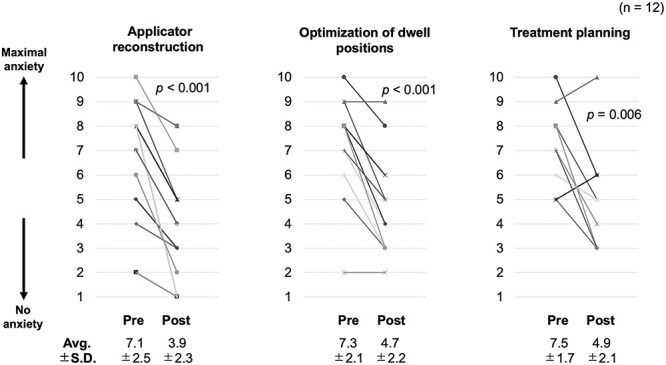
Fig. 3.

Changes in the quantitative responses of participants (radiologic technologists and medical physicists) before and after the course. Each graph shows the change in degree of anxiety for each item, with 10 indicating maximum anxiety and 1 indicating no anxiety. Avg. = average, SD = standard deviation.
