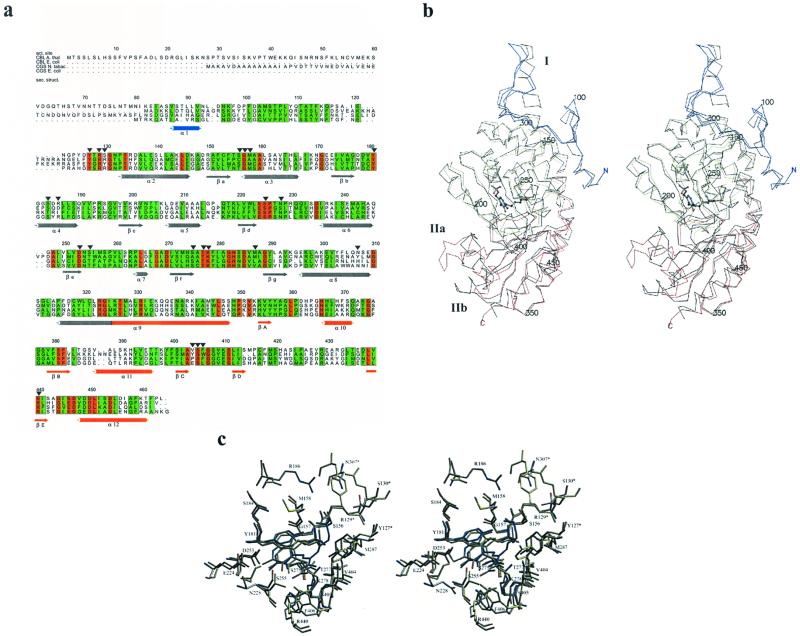
Figure 5.
Comparison of aCBL and E. coli CBL. a, Sequence alignment; numbering is given for aCBL. Arrows show aCBL active site residues; secondary structure elements (colored by domain) are shown. Conserved and homologous amino acids are boxed red and green, respectively. The figure was produced using the GCG package (GCG, Inc., Madison, Wisconsin) and the program ALSCRIPT (Barton, 1993). b, Stereo plot of the Cα-traces of aCBL (N-terminal domain is blue, PLP-binding domain is yellow, and C-terminal domain is red); the corresponding trace of eCBL (black) is superimposed. PLP is drawn as a ball and stick model. The figure was created using MOLSCRIPT (Kraulis, 1991). c, Stereo plot of the superimposed active sites of aCBL and eCBL. The aCBL residues with the PLP cofactor are colored by atom type, the residues of eCBL and the inhibitor AVG are drawn in yellow and blue, respectively. The figure was produced with SETOR (Evans, 1993).

