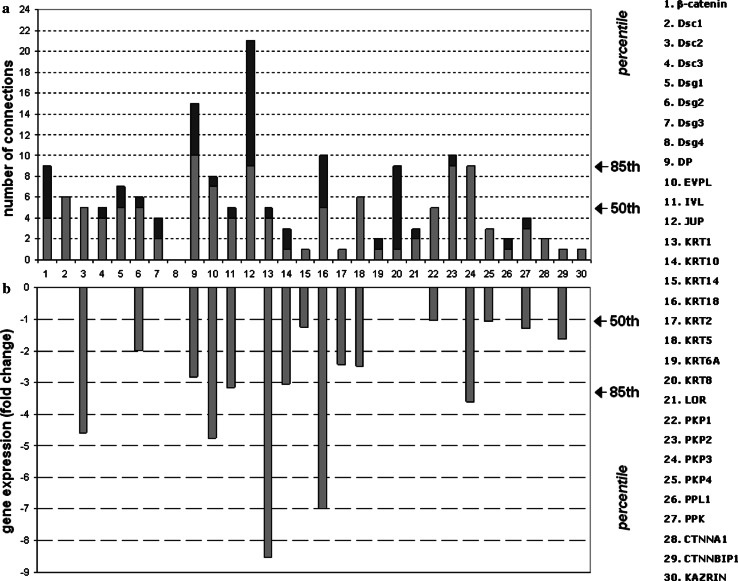
Fig. 7.
Correlation between connectivity rates (a) and gene changes in experimental PV (b) of the 30 intrinsic components forming the desmo-adhesome. The number of connections of the 30 intrinsic nodes reported as a histogram (a). The light colour represents the (binding) interactions with other intrinsic components of the desmosomal interactome, whereas the interactions with nodes of the regulatory subnet are in dark colour. The range of connectivity has been reported as a percentile on the right side of the panel. b Signal log ratio of keratinocyte gene expression changes occurring in the mouse model of PV

