
Fig. 2.
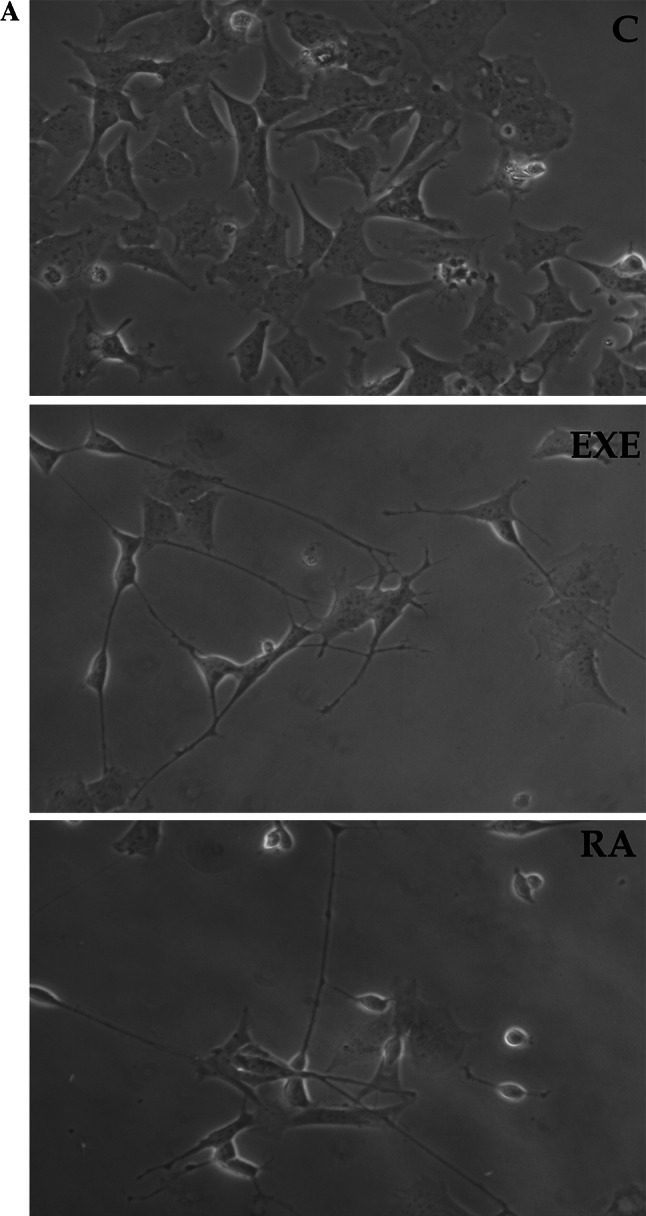
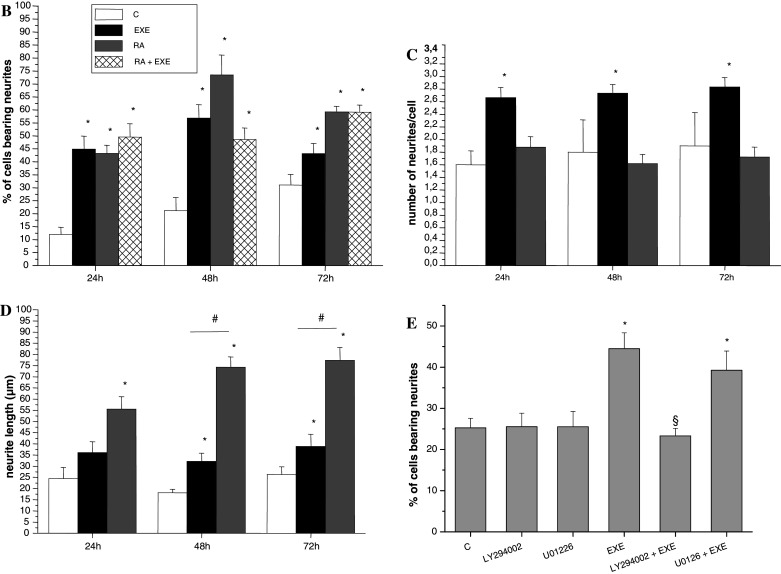
a Phase-contrast inverted microscopy (40× magnification) pictures showing the morphology of SH-SY5Y cells before (C) and after 48-h treatment with exendin-4 (EXE) or with the differentiation positive control RA. b–d Analysis of the morphological changes induced by exendin-4 (EXE) (black bars), RA (grey bars) or EXE + RA (sparse pattern bars) compared to untreated cells (C, white bars) evaluated at different times (24, 48, and 72 h); b Percentage of cells bearing neurites; c number of neurites per cell; d Neurite length (μm) * = p < 0.05 versus C; # = p < 0.05 versus exendin-4, one-way ANOVA test. e Effects of specific signaling inhibitors on EXE-induced differentiation: percentage of cells bearing neurites after exposure to EXE with or without the PI-3 K inhibitor LY294002 or the MAPK/ERK kinase inhibitor U0126. * = p < 0.05 versus C; § = p < 0.05 versus EXE, Student’s t test