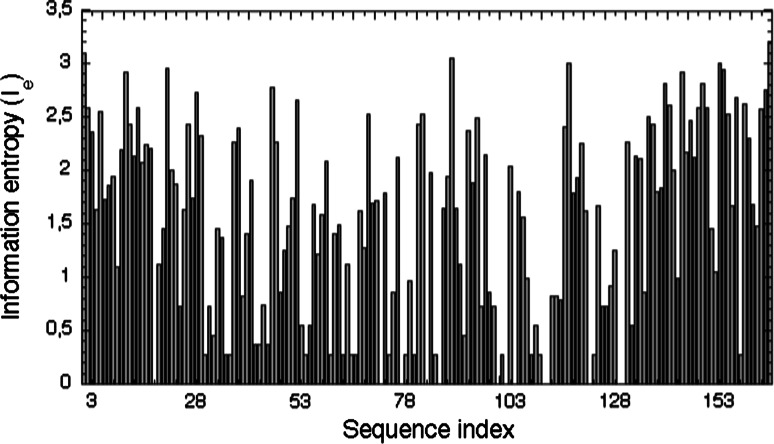
Fig. 3.
Information entropy (I e) histogram for the human CLDs (see ESM Fig. Fs5). Low I e values indicate that thye given sequence position is well conserved (a low variability in the AAC) whereas the I e ≥ 1.0 indicate for a higher variability of the AAC at the given sequence position (maximal I e for 20 natural AAs equals to log220 = 4.322)

