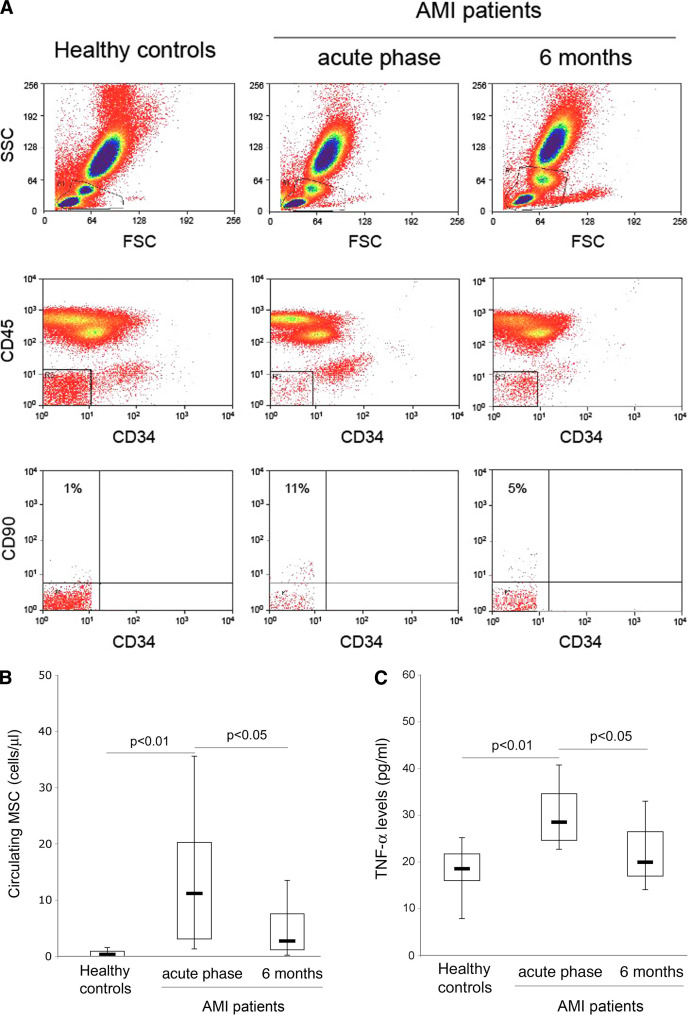
Fig. 1.
Comparison of the circulating MSC and TNF-α levels between healthy control subjects and AMI patients. Circulating levels of putative MSC were quantified in blood of AMI patients and of healthy donors by multi-parametric flow-cytometry, utilizing the CD34/CD45/CD90 antibody combination (a, b). a Representative FACS plots of controls and AMI patients, examined during the acute phase and at 6 months after AMI, show the gating strategy adopted to identify circulating MSC. Mononuclear cells were chosen on the basis of their physical properties (FSC/SSC; top panels). CD45 −/CD34 − cells (middle panels) were gated and this subpopulation was further characterized for the expression of CD90; percentages of CD90 +/CD34 − are reported in the top left quadrants (bottom panels). b Circulating cell concentration is expressed as number of cells/μl of blood. c Serum levels of TNF-α were evaluated in AMI patients and in healthy control subjects by ELISA. In b and c, horizontal bars at median, upper, and lower edges of box are 75th and 25th percentiles, lines extending from box are 10th and 90th percentiles

