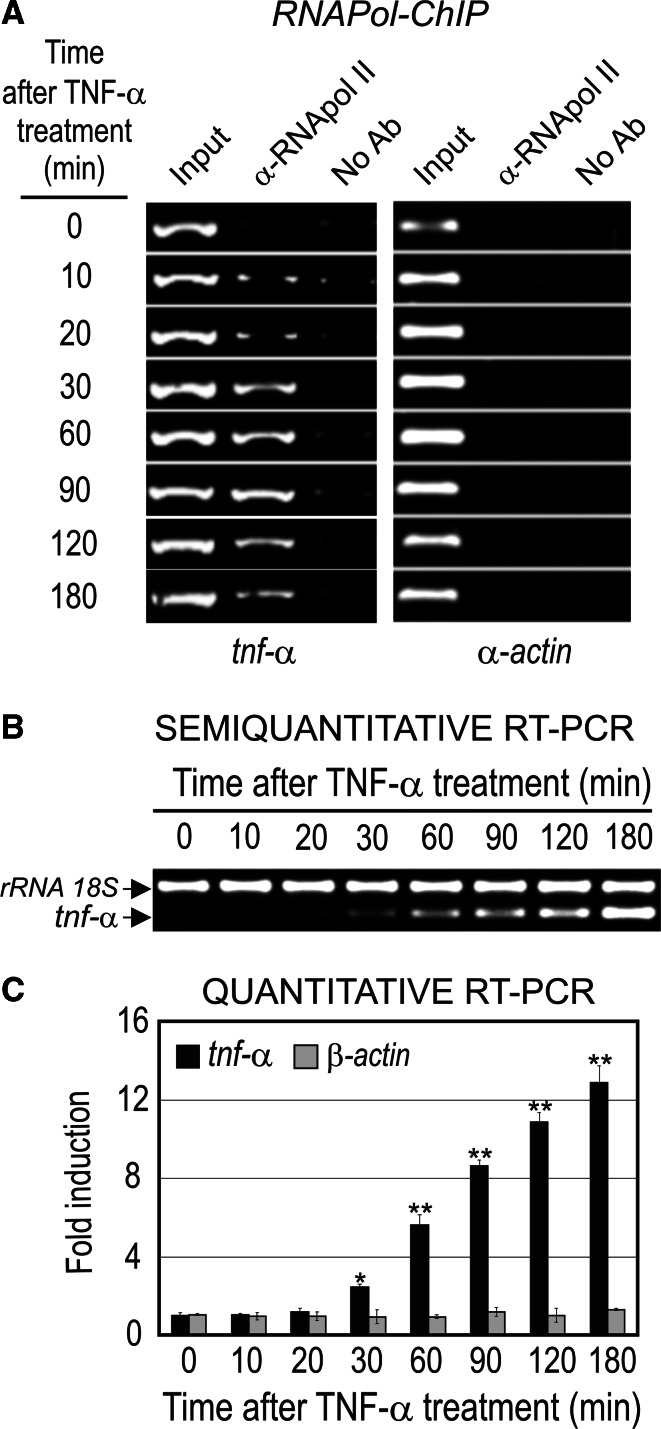
Fig. 4.
The
tnf-α gene expression in TNF-α-activated AR42J cells. a RNApol ChIP analysis. b Semiquantitative RT-PCR and c quantitative RT-PCR analysis of the tnf-α mRNA level. rRNA 18S was used as an internal control and β-actin as negative control of the RT-PCR analysis and α-actin as negative control of ChIP assay. The statistical significance is indicated as follows: **P < 0.01 or *P < 0.05 vs. control or time 0

