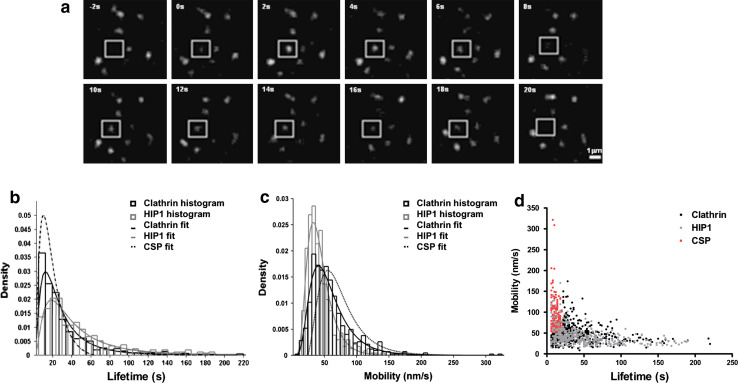
Fig. 2.
HIP1 and clathrin display similar dynamics at the PM. a An example of a short-lived (18 s) HIP1 assembly (box). b Histograms displaying the lifetime distributions for the two proteins. Curves represent log-normal fittings for the data. Hatched curves represent the fit for the predicted shorter lived subpopulation of clathrin assemblies (CSP) (n = 661 and 439; from 10 and 11 cells for clathrin and HIP1, respectively). c Histograms displaying the point-to-point velocity distribution for the two proteins. Curves represent log-normal fittings for the data. Hatched curves represent the fit for the predicted faster-moving subpopulation of clathrin assemblies (CSP). d Correlation plot displaying assemblies velocity vs. lifetime. Note clathrin’s subpopulation of assemblies (CSP) with shorter lifetimes and greater mobility

