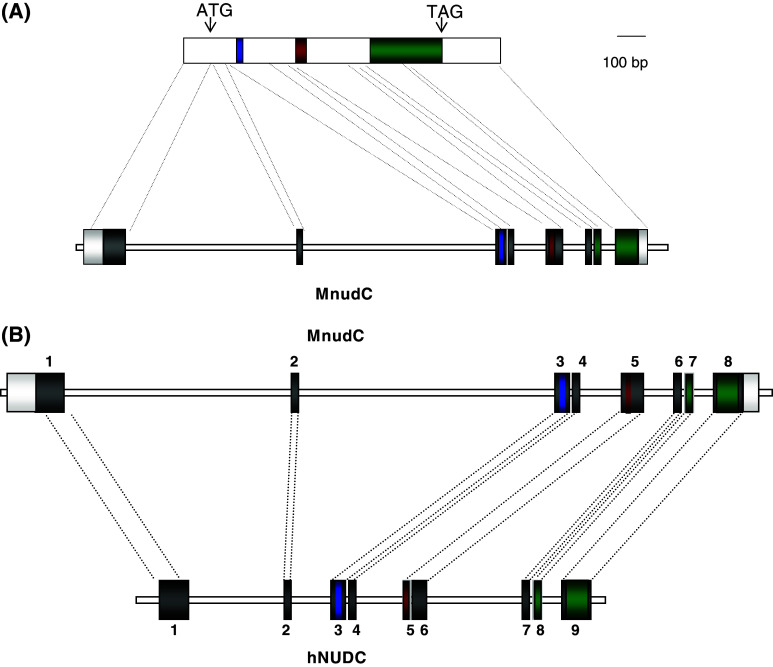
Fig. 3.
Structure of the mouse and human NudC genes. a Schematic drawing of the mouse NudC cDNA (upper) and the mNudC gene (lower). In the cDNA the three regions highlighted in Fig. 2 are indicated. The relative positions of the initiation (ATG) and termination (TAG) codons are also shown. The NudC gene depicts the exon–intron distribution. The 100-bp scale refers only to cDNA. b Comparison of the murine and human genes showing their exon–intron distribution. The relative sizes of introns in both genes is depicted. The human gene spans for 8 kb while the mouse gene spans for 15 kb

