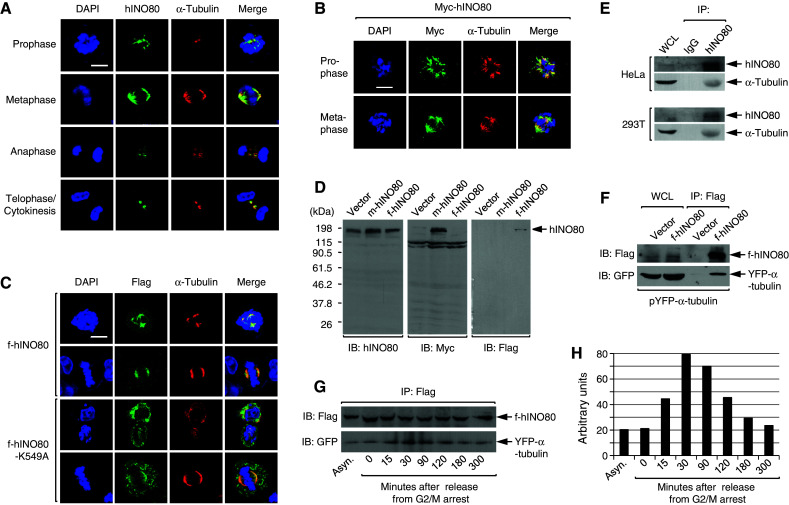
Fig. 6.

hINO80 is associated with spindle microtubules during the entire mitosis. a HeLa cells were released from G2/M arrest for various times and fixed for staining with the antibodies for hINO80 and α-tubulin. Representative confocal images are shown. b 293T cells were transfected with the myc-hINO80 vector, and after release for various times from G2/M arrest cells were fixed for staining with the myc antibodies. Representative confocal images are shown. c 293T cells were transfected with the f-hINO80 or f-hINO80-K549A vectors and arrested at G2/M. After release for various times, the cells were fixed for staining with the antibodies for Flag and α-tubulin. Representative confocal images are shown. d 293T cells were transfected with empty, myc-hINO80, or flag-hINO80 vectors, and whole-cell lysates were analyzed by immunoblotting using the hINO80 antibodies. The same blot was re-probed sequentially by myc and flag antibodies. e HeLa and 293T cells were released from G2/M arrest for 30 min, and whole-cell lysates were prepared for IP with the hINO80 antibodies and IgG as a control. The IP samples were subjected to immunoblot analysis to examine the interaction between the endogenous hINO80 and α-tubulin proteins. f 293T cells were cotransfected with pYFP-α-tubulin plus either empty or the f-hINO80 vectors, and after 30-min release from G2/M arrest, whole-cell lysates were prepared for IP with the Flag antibodies to determine the interaction between f-hINO80 and YFP-α-tubulin. g 293T cells transfected as in (f) were cultured asynchronously or released for various times from G2/M arrest before harvest, and whole-cell lysates were prepared and subjected to IP with the Flag antibodies followed by immunoblot analysis as indicated. A representative gel of three independent experiments is shown. h The gel in (g) was quantitated by densitometer and the relative intensity of YFP-α-tubulin bands after normalization to f-hINO80 bands was depicted as a graph
