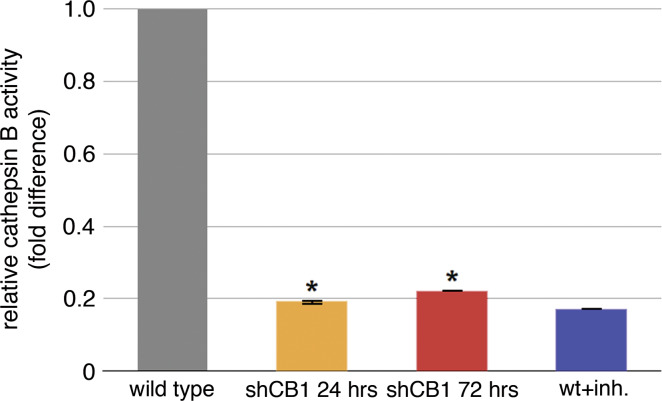
Fig. 5.
Analysis of SmCB1 proteolytic activity. Fluorescence was measured in a fluorometer with excitation at 355 nm and emission at 460 nm in a 200-μl reaction mix of 1 μg total protein (1:200 dilution) and 20 μM substrate for 200 cycles, with 15 flashes at gain 5 and 37°C. In the control samples, 20 μM of inhibitor was pre-incubated with the extracts prior to addition of the substrate. Data were measured as relative cathepsin B activity in units/sec and expressed as a fold difference compared to the wild-type (not exposed to virions) control. Results are averaged from three independent experiments. Significance at p < 0.0001 is indicated by an asterisk

