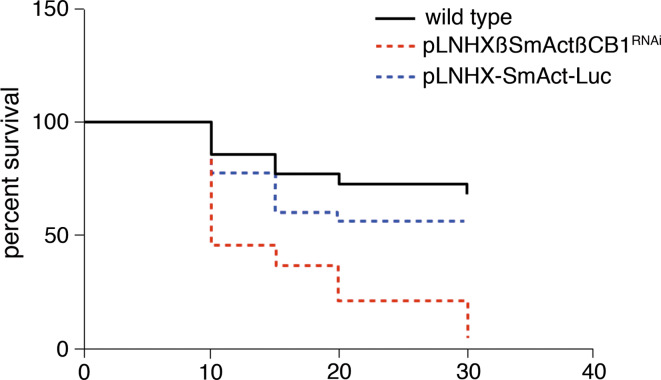
Fig. 6.
Kaplan–Meier survival curve. A representative set of survival curves (out of three independent experiments) is shown. A 95% confidence interval for fractional survival at any particular time was calculated by both the log-rank (Mantel–Cox) test and the Gehan–Breslow–Wilcoxon test. The survival curves show significance when either the wild-type (p < 0.0001) or the pLNHX-SmAct-Luc control (p = 0.0002) is compared to pLNHX-SmAct-CB1RNAi and no difference is observed when only the two controls are considered (p = 0.07) (GraphPad Prism 5) and [26]

