Fig. 2.
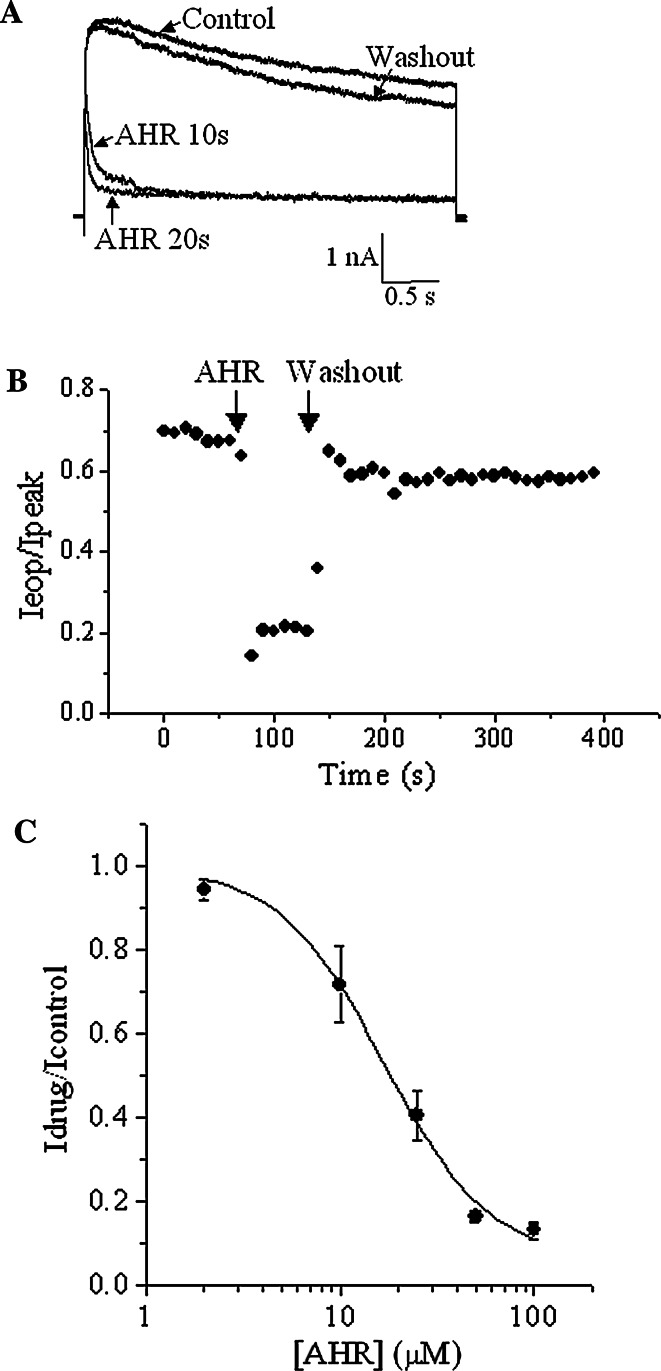
AHR accelerated slow inactivation of Kv1.2 currents. a Representative traces showing outward K+ currents triggered by +30 mV before AHR addition, after 10 and 20 s of 50 μM AHR treatment, and after AHR washout. b The ratio of end-of-pulse current/peak current (I eop/I peak) as observed in (a) are plotted against time. Similar results were obtained in four more experiments. c With +30 mV stimulation, the end-of-pulse Kv current in the presence of AHR is normalized with the maximum end-of-pulse current (in the absence of AHR) and then plotted against AHR concentrations. The curve is fitted with the Hill equation. Results are means ± SEM from three to four cells

