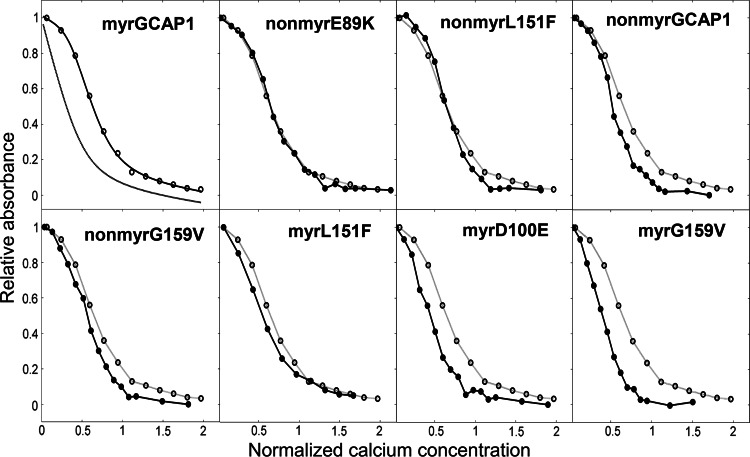
Fig. 3.
Ca2+-titration curves for the eight variants of GCAP1. In the upper left panel, the experimental points for myrGCAP1 (empty circles) are shown together with the optimal curve by computer fitting (see “Materials and methods”) and the theoretical (simulated) curve for a protein that binds Ca2+ several orders of magnitude lower than the chelator. The curves include the effects of dilution upon titration. In the other panels, empty circles and grey curves refer to myrGCAP1, reported for comparison, while filled circles and black curves refer to one representative set of titration data obtained for that variant. The axes have been normalized in the following way:  , where A263 is the absorbance read at 263 nm, ACa is the fitted absorbance at saturating Ca2+, and A0 is the fitted absorbance in the absence of Ca2+ additions,
  , where [Ca2+]tot is the total Ca2+ concentration (μM) after each addition, C
Q is the total concentration of the chelator (μM), C
p the total concentration of the protein (μM), and 3 is the number of Ca2+-binding sites per protein variant

