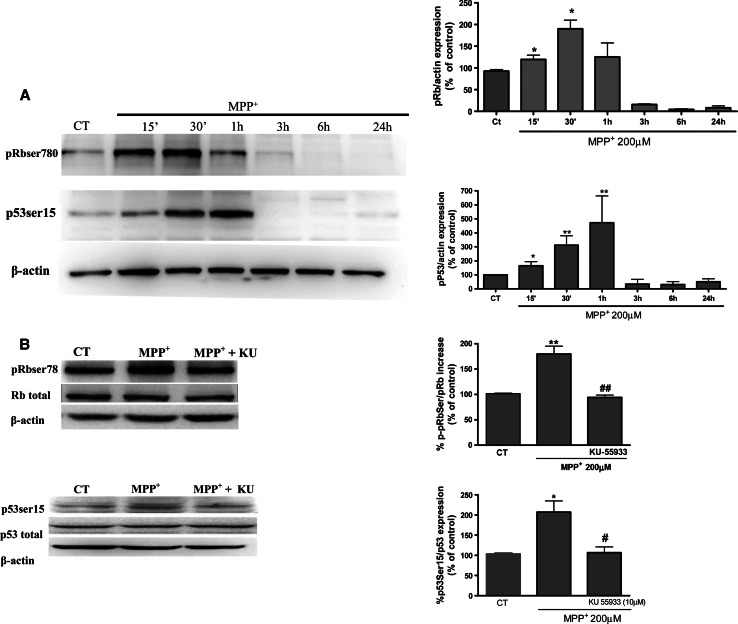
Fig. 3.
a Representative immunoblots showing the expression of pRbser780 p53-ser15 in CGC after a time course treatment with MPP+. Band intensities were calculated as percentages of the control. b Representative immunoblots showing the expression of pRb-ser780 and p53-ser15 in CGC after a treatment with MPP+ for 30 min alone or in presence of KU-55933 (10 μM). Columns and bars represent the mean ± SEM of four or five separate experiments with four or five different culture preparations (n = 4). Statistical significance was determined by one-way ANOVA followed by Tukey’s tests: *p < 0.05, **p < 0.01, ***p < 0.001 versus control. #p < 0.05; ##p < 0.01; ###p < 0.001 versus KU-55933 treatment

