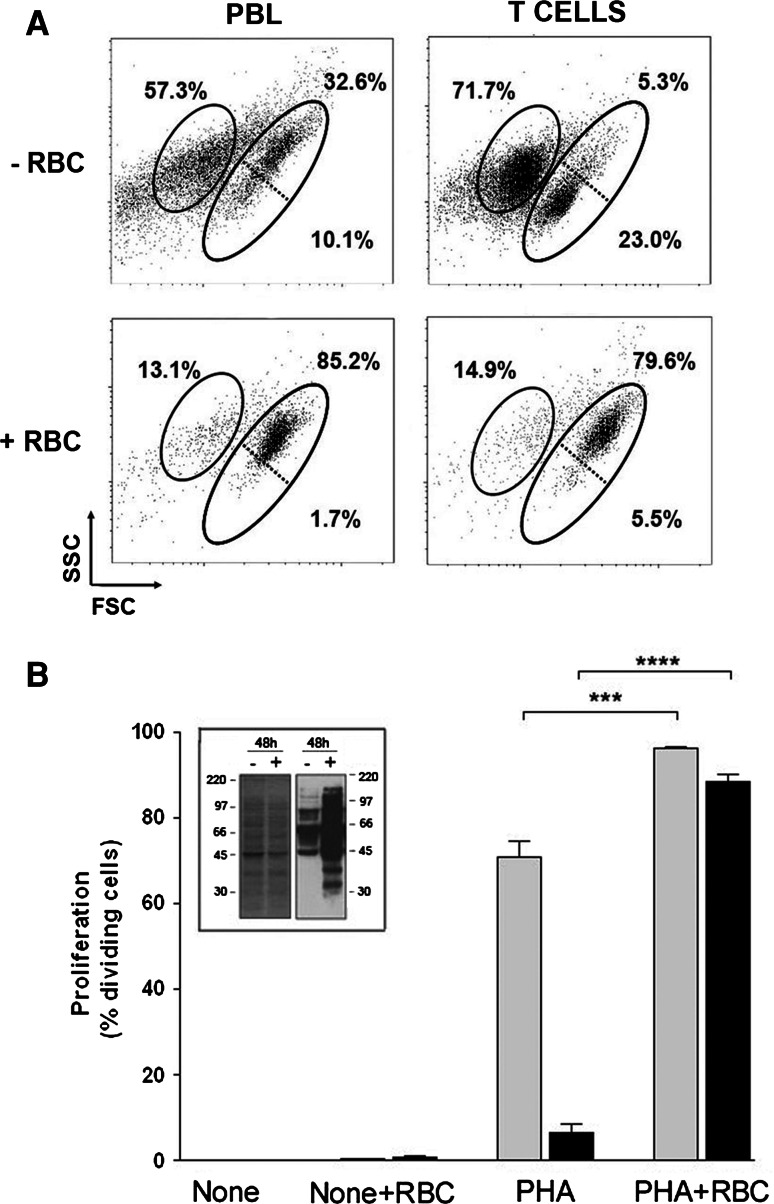
Fig. 4.
RBC bioactivities rescue activated T cells from cell death. PBLs or purified T cells (1.5 × 10⁶) were labeled with CFSE, stimulated with 5 μg/ml of PHA and cultured in the absence or presence of RBC for 7 days. Then, cells were harvested and acquired in a FACSCalibur. a Dot plots (FCS vs. SSC) show the percentage of T cell death (left gated population, as determined by positive PI labeling) and survival (right gated population, as determined by negative PI labeling) of PHA-activated PBLs or T cells cultured alone (−RBC) or in the presence of RBC (+RBC). Also shown are the percentage of small (lower right gated population) and blast (upper right gated population) cells. b The graph shows the percentage of proliferating cells (mean ± SEM, n = 6) in cultures of PHA-stimulated PBLs (gray bars) or PHA-stimulated T cells (black bars) in the absence or presence of RBC. The percentage of proliferating cells in unstimulated (none) cultures are included (****p < 0.0001; ***p < 0.001). Inset: Cell lysates of 48-h cultures of PBLs activated with PHA in the absence (−) and presence (+) of RBC were labeled with BIAM as described in “Materials and methods,” and two aliquots of the cell lysates were run on separate SDS/PAGE under non-reducing conditions. One of the gels was stained with Coomassie blue to visualize the total amount of protein (left graph). The other gel was blotted into membranes and thiols-containing proteins visualized by the ECL technique (right graph). Molecular weight markers are indicated

