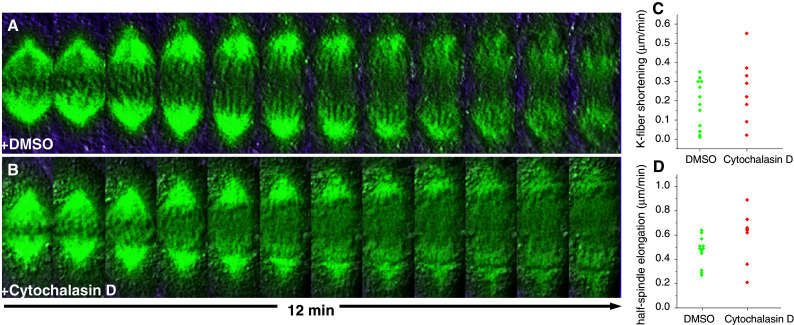
Fig. 5.

a, b Time-lapse sequences of LLC-PK cells stably expressing GFP-α-tubulin after treatment with DMSO or 20 μM Cytochalasin D, respectively. Chromosomes can be visualized by differential interference contrast in the superimposed image. Time between frames = 1 min. c, d Distributions of measurements of k-fiber shortening and half-spindle elongation velocities after treatment with DMSO or 20 μM Cytochalasin D. The mean k-fiber shortening velocities in DMSO and Cytochalasin D were, respectively, 0.19 ± 0.13 (n = 6 cells) and 0.26 ± 0.17 (n = 4 cells) for the represented period. Error intervals represent standard deviation. The differences are not statistically significant (P = 0.296; t test). The median half-spindle elongation velocities in the same cells after DMSO or Cytochalasin D were, respectively, 0.47 ± 0.12 and 0.60 ± 0.21. Error intervals represent standard deviation. The differences are not statistically significant (P = 0.058; Mann–Whitney rank sum test)
