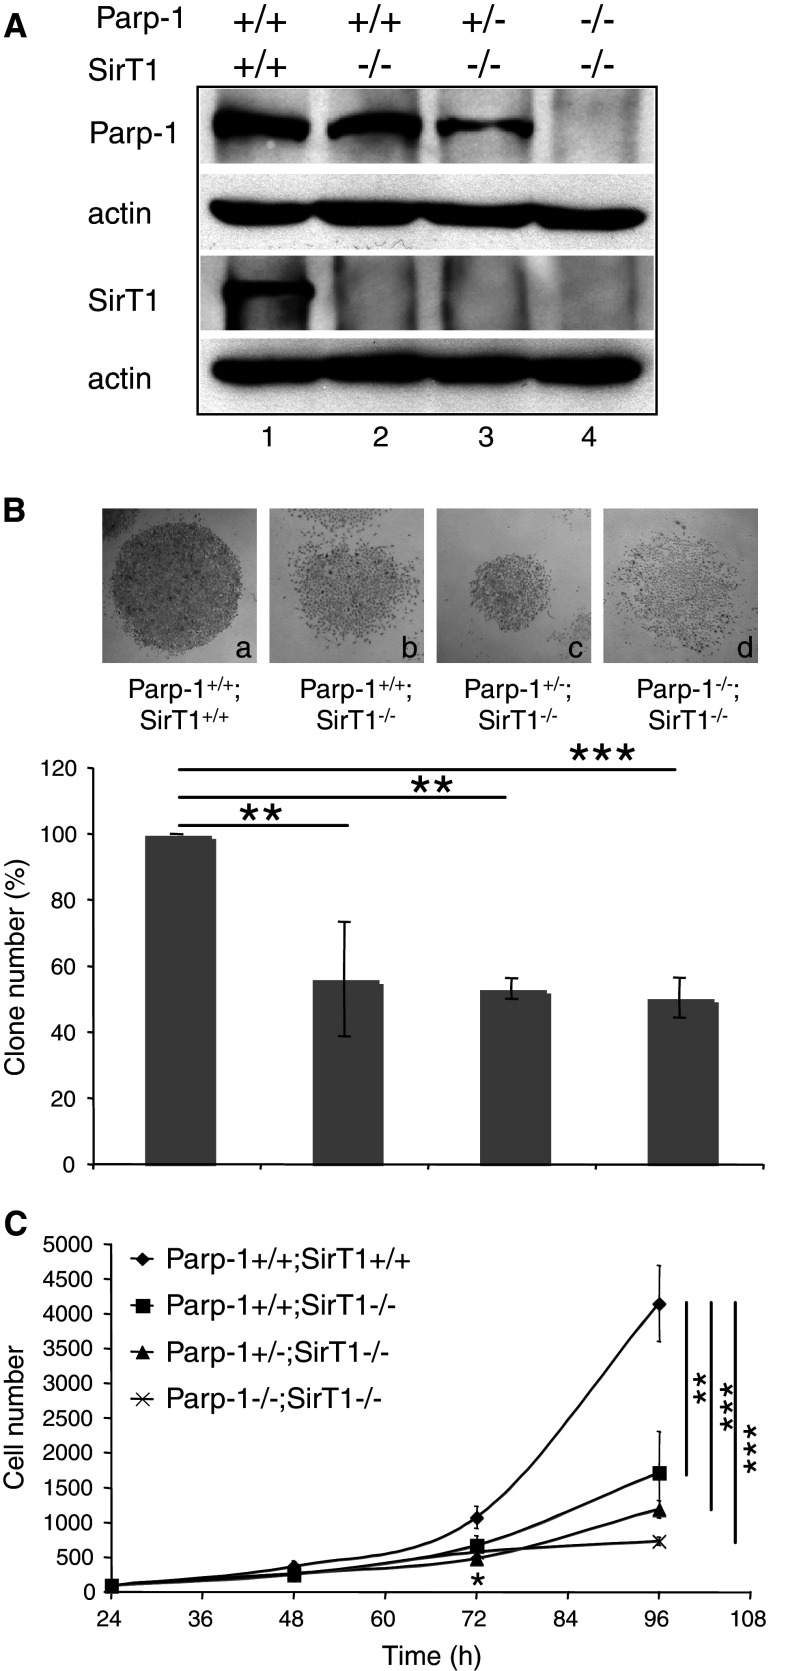
Fig. 1.
Establishment, and growth of Parp-1+/+;SirT1+/+, Parp-1+/+;SirT1−/−, Parp-1+/−;SirT1−/−, and Parp-1−/−;SirT1−/− 3T3 cell lines. A Western blot analysis for the expression of Parp-1, SirT1 and β-actin in spontaneously immortalized MEFs (3T3). Equivalent amounts of total protein extracts from wild-type Parp-1+/+;SirT1+/+ (lane 1), Parp-1+/+;SirT1−/− (lane 2), Parp-1+/−;SirT1−/− (lane 3), and Parp-1−/−;SirT1−/− (lane 4) 3T3 cells were separated by SDS-PAGE and analyzed by western blotting with the appropriate antibodies. B Clonogenic assay. Colonies were stained with 0.1% crystal violet in ethanol and counted by visual inspection. Insets represent a microphotography of one representative colony for each genotype. Data are presented as the percent of control colony number. Each point represents the mean of triplicate samples. Data shown are representative of results obtained in three different experiments. P value was calculated by ANOVA test: **P < 0.01, ***P < 0.001. C Growth curves. Equal cell numbers of Parp-1+/+;SirT1+/+ (filled diamond), Parp-1+/+;SirT1−/− (filled circle), Parp-1+/−;SirT1−/− (filled triangle), and Parp-1−/−;SirT1−/− (×—×) were plated in six-well plates, and for each experiment, triplicate wells were counted over a period of 4 days. Points represent the mean of three independent experiments. P value was calculated by ANOVA test comparing the different genotypes to the control cell line: *P < 0.05, **P < 0.01, ***P < 0.001

