Fig. 6.
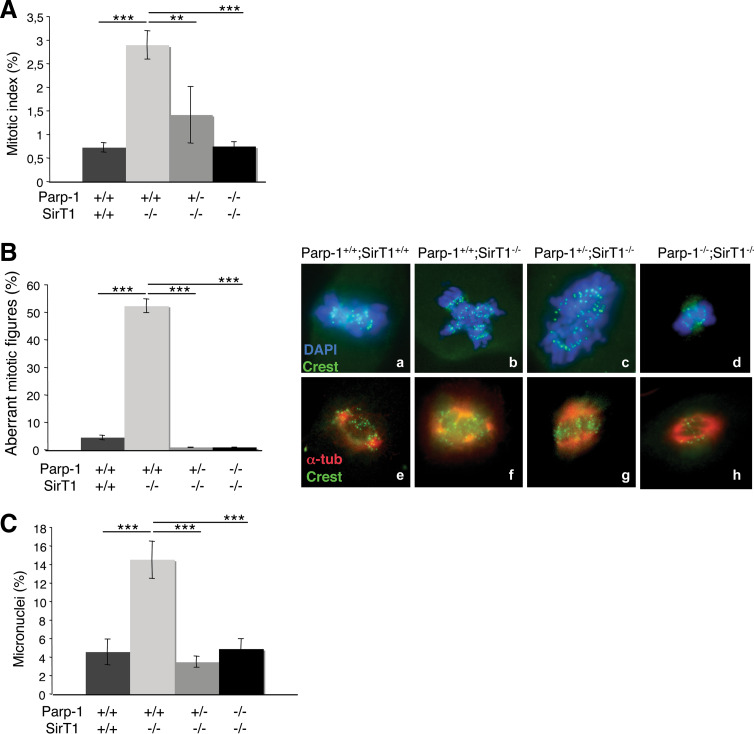
Interplay of Parp-1 and SirT1 in the regulation of mitotic division. A Histogram showing the percentage of Parp-1+/+;SirT1+/+, Parp-1+/+;SirT1−/−, Parp-1+/−;SirT1−/− and Parp-1−/−;SirT1−/− cells in mitosis. Cells (prometaphase–metaphase–anaphase–telophase) were scored by immunofluorescence (DAPI staining). Values represent the mean (±SD) of three independent experiments (n = 500). P value was calculated by ANOVA test: ** P < 0.01 and *** P < 0.001. B Left panel Histogram showing the percentage of aberrant mitosis for each genotype indicated. Cells were scored by DAPI staining. Values represent the mean (±SD) of three independent experiments (n = 500). Right panel Immunofluorescence of Parp-1+/+;SirT1+/+ (a,e), Parp-1+/+;SirT1−/− (b,f), Parp-1+/−;SirT1−/− (c,g), and Parp-1−/−;SirT1−/− (d,h) paraformaldehyde-fixed cells showing measurements of centromere disposition (upper panel, a–d) by the staining of centromeric proteins (Crest, green) and DNA (DAPI, blue) and measurements of spindle structure (lower panel, e–h) by the staining of the spindle (α-tubulin, red) and DNA (DAPI, blue). P value was calculated by ANOVA test: ***P < 0.001. C Histogram showing the percentage of Parp-1+/+;SirT1+/+, Parp-1+/+;SirT1−/−, Parp-1+/−;SirT1−/− and Parp-1−/−;SirT1−/− cells with micronuclei. Cells were scored by DAPI staining. Values represent the mean (±SD) of three independent experiments (n = 500). In Parp-1+/+;SirT1−/− cells, the number of aberrant mitotic figures (chromosome missegregation) and the number of micronuclei (genomic instability) increased considerably compared with that in Parp-1+/+;SirT1+/+ as well as Parp-1+/−;SirT1−/−, and Parp-1−/−;SirT1−/− cells. P value was calculated by ANOVA test: ***P < 0.001

