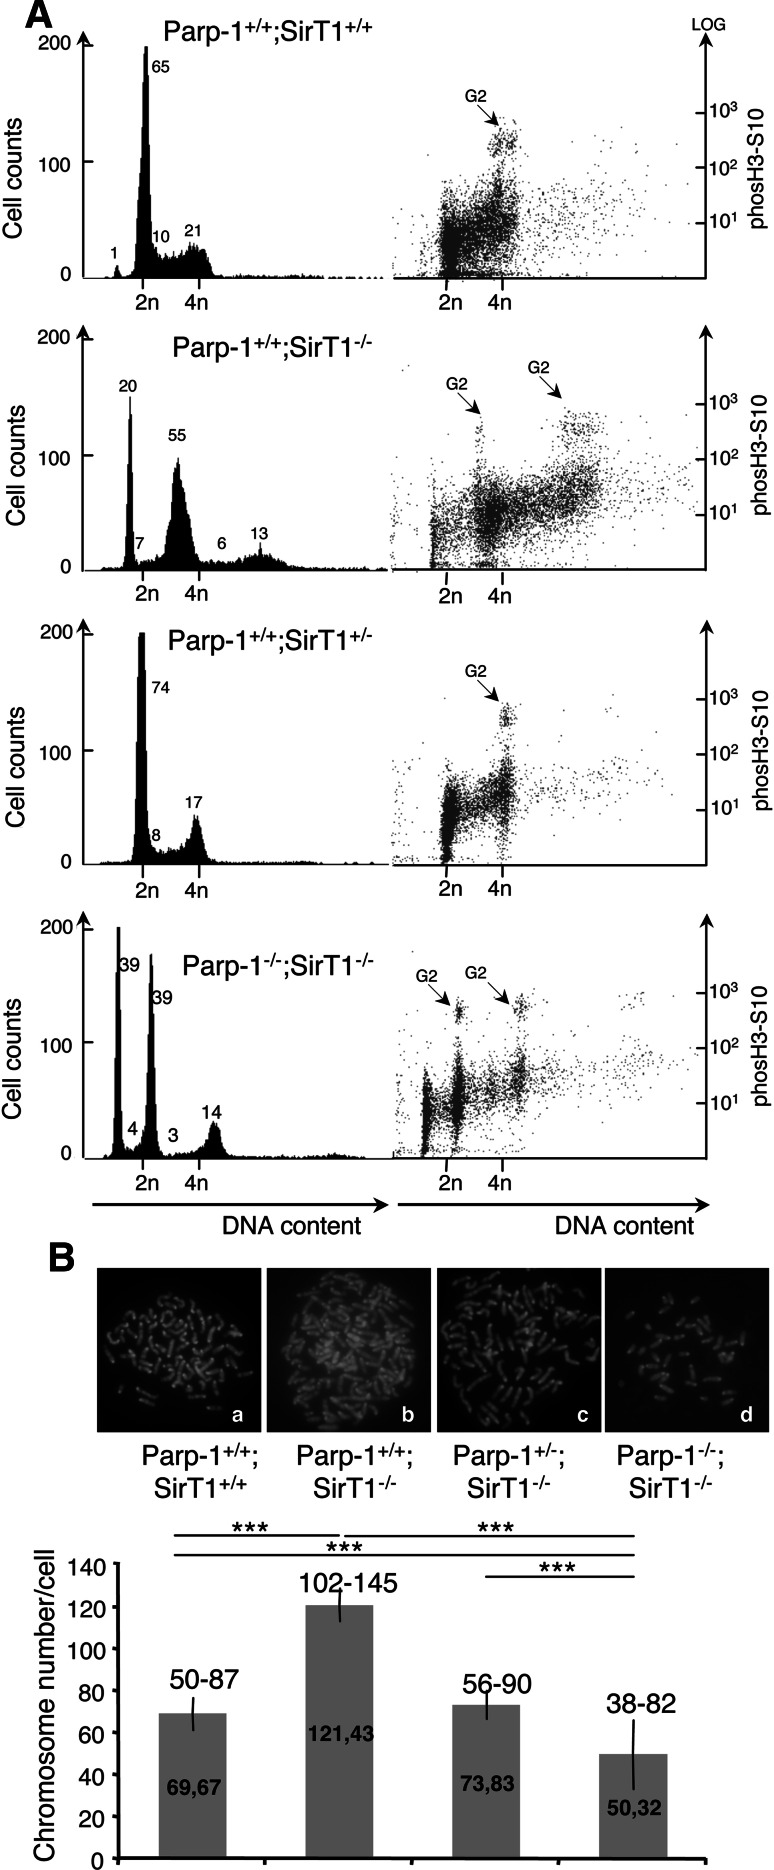
Fig. 7.
Increased DNA content in SirT1-deficient cells suppressed by the additional disruption of Parp-1. A FACS analysis of Parp-1+/+; SirT1+/+, Parp-1+/+;SirT1−/−, Parp-1+/−;SirT1−/−, and Parp-1−/−;SirT1−/− cells. The right hand part shows the identification of cells in G2/M by phosH3S10 staining versus DNA content. The majority of Parp-1+/+;SirT1−/− cells display an increased DNA content compared to the control Parp-1+/+;SirT1+/+ or the Parp-1+/−;SirT1−/− and Parp-1−/−;SirT1−/− cells. Some Parp-1−/−;SirT1−/− cells also evidence a lower DNA content. The profiles shown are representative of three independent experiments. B Karyotype analysis showing a significantly increased chromosome number in Parp-1+/+;SirT1−/− cells (b) compared to the control Parp-1+/+;SirT1+/+ (a) or the Parp-1+/−;SirT1−/− (c) and Parp-1−/−;SirT1−/− cells (d). At least 30 individual metaphases were counted per cell line. The mean value (±SD) of three independent experiments is shown on the histogram bars. The range of chromosome numbers is indicated on the top. Note, the identification of Parp-1−/−;SirT1−/− cells with a reduced number of chromosomes (n = 38) compared to Parp-1+/+;SirT1+/+ cells (n = 50). P value was calculated by ANOVA test: ***P < 0.001

