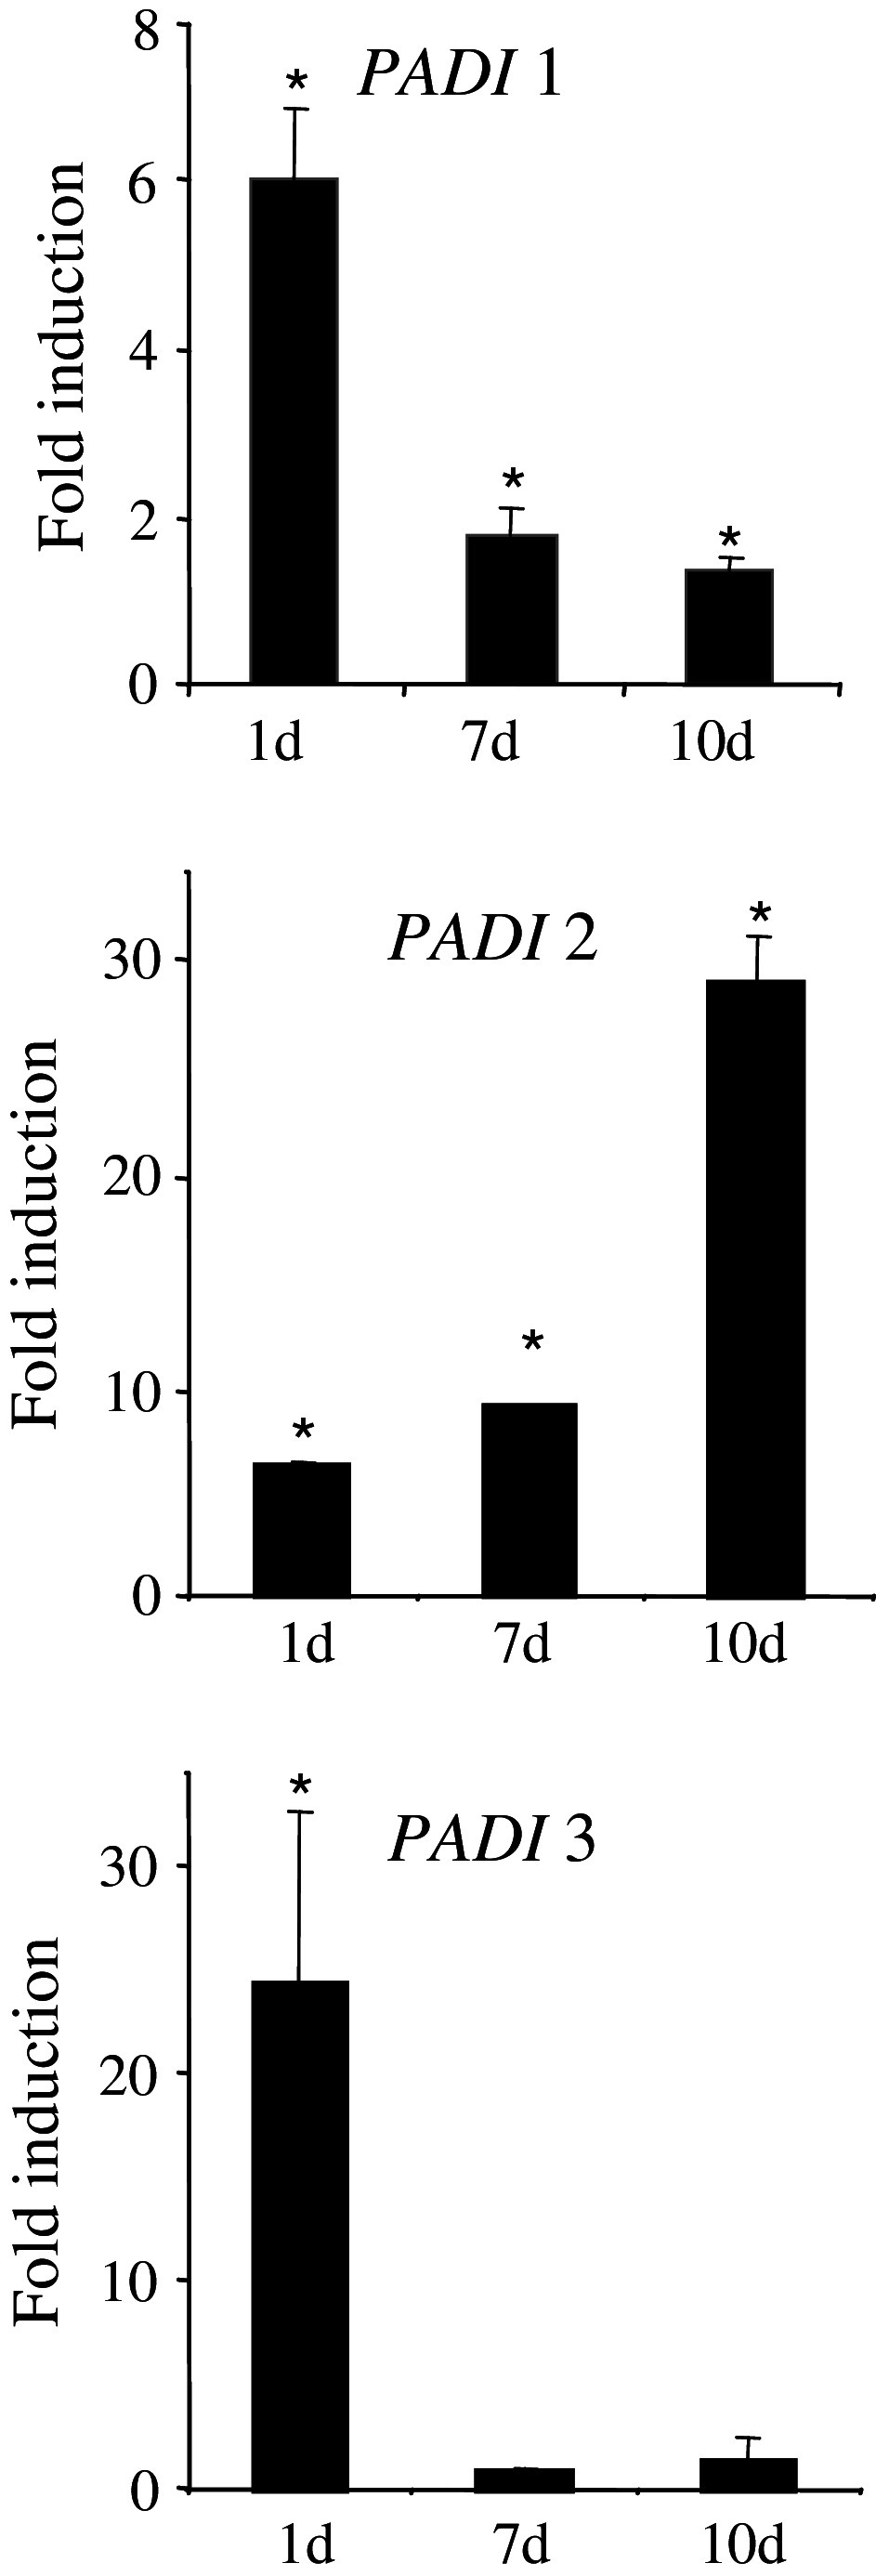
Fig. 1.
Effect of Vit D on PADI1–3 transcript levels in NHKs at 1, 7, and 10 days. Quantitative RT-PCR analysis of the steady-state levels of PADI1–3 mRNAs was performed using NHKs treated for 24 h with either 10−7 M Vit D in DMSO or DMSO alone (control), harvested at the indicated time, and using the YWHAZ mRNA as the reference to normalize. The ratios (treated/control) are expressed as mean ± SEM for a representative experiment performed in duplicate from among at least three independent experiments (*P < 0.05)

