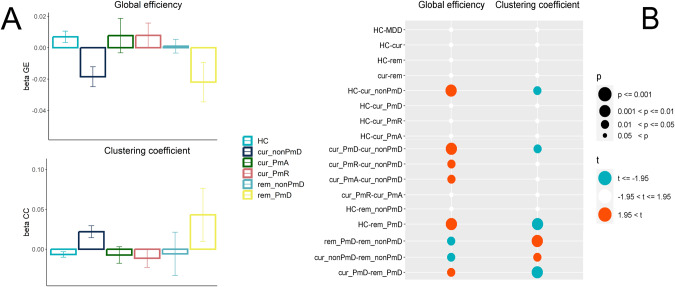
Fig. 2. Graph theory of the motor network functional connectivity.
A Effects for graph theoretical measures of the motor network per group (beta values and standard errors). B Between-group differences in global efficiency and clustering coefficient of the motor network. Effects adjusted for MR hardware and software changes, mean framewise displacement, age, and sex. HC healthy controls, cur currently depressed patients, rem remitted patients, PmD psychomotor disturbance, PmA psychomotor agitation, PmR psychomotor retardation.

