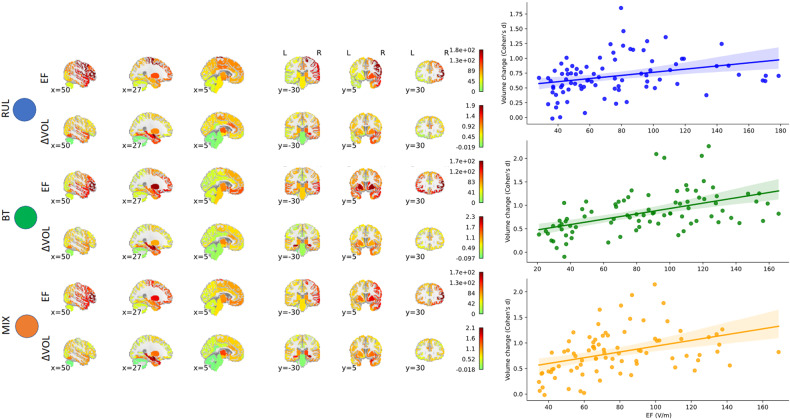
Fig. 1. The relationship between Electric Field (EF) and volume change (ΔVOL).
On the left side of the figure, brain images illustrate the spatial distribution of EF (1st, 3rd, and 5th rows, V/m) and ΔVOL (2nd, 4th, and 6th rows, Cohen’s d). The first two rows depict results from RUL placement (n = 246), the next two rows show results from BT placements (n = 79), and the last two rows display results from MIX placements (n = 61). These regions were segmented into 85 cortical and subcortical areas (refer to methods). Throughout the manuscript, we designated the results from RUL as blue, BT as green, and MIX as orange for color coding consistency. The right panel illustrates the corresponding values across the 85 regions, showcasing the correlation between EF and ΔVOL in RUL, BT, and MIX, respectively.

