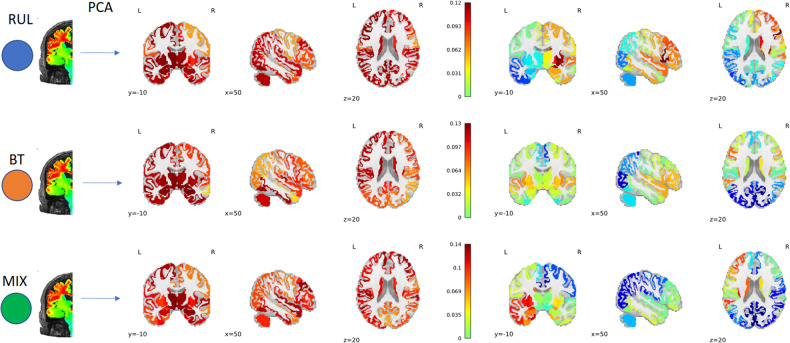
Fig. 3. Unsupervised multivariate analysis was conducted using Principal Component Analysis (PCA) on the EF values.
The outcomes (loadings of PCA) are displayed in three rows: the top row represents the findings for subjects with RUL placement, the middle row shows results for patients with BT placement, and the bottom row illustrates subjects with MIX placement. The first component (PC1EF; left side) shows the main effect. The second PC of the EF (PC2EF) reflects the spatial distribution stemming from the different electrode placements.

