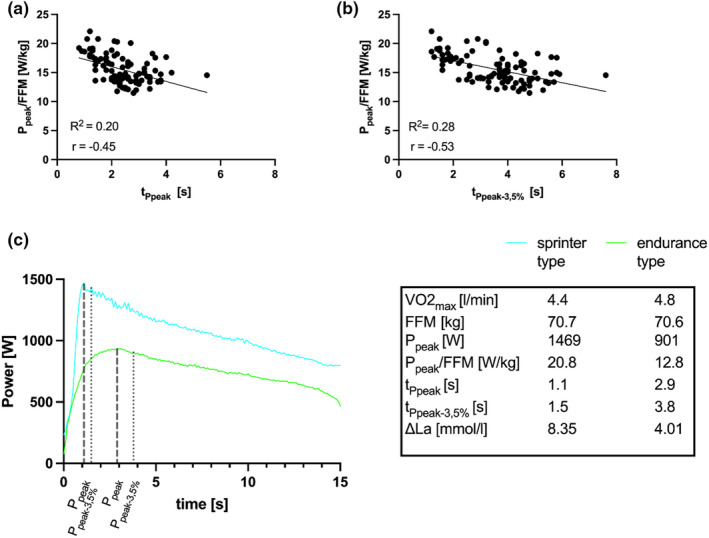
FIGURE 5.

Relation between Ppeak/FFM and tPpeak (a) and tPpeak–3.5% (b), (c) example of sprint power data over 15 s, Ppeak, tPpeak, Ppeak–3.5% and tPpeak–3.5% for two male cyclists of similar stature and body mass for sprinter type versus endurance type (see legend for individual data).
