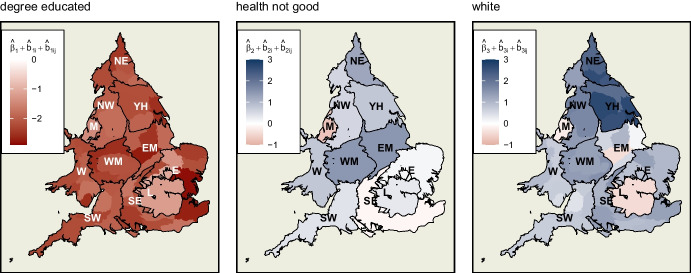
Fig. 9.
Net hierarchical effects of each variable. These are the sum, for each coefficient, of its fixed effect and two random effects (at region and county level), showing the spatial heterogeneity accounted for by the hierarchical component of the model. ‘Degree educated’ is negatively associated with swing to the Conservatives across England and Wales, albeit to different extents. ‘Health not good’ and ‘white’ show not only different magnitudes but also different directions of association with swing in different regions and counties across the study area

