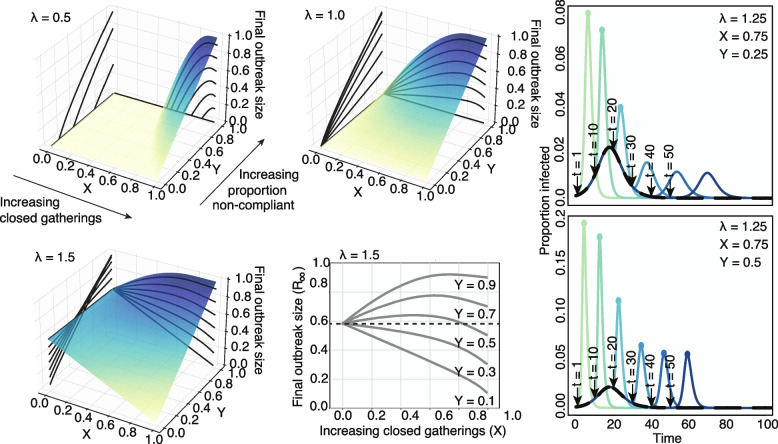
Fig. 1.
Final state of the SIR dynamics with variable disease infectiousness and intervention scale. Surfaces and contours show the final sizes of outbreaks across a range of intervention effects (X, proportion of closed gatherings) and proportion of non-compliant individuals who travel to open gatherings (Y). Three levels of infectiousness are illustrated (). We see that the worst-case scenario is a function of , X and Y, as there is no consistent ranking in outbreak sizes. Small interventions appear beneficial against very transmissible pathogens but risk lowering the epidemic threshold at high frequency of non-compliant individuals, and larger interventions accentuate this effect. The bottom middle panel highlights this effect: we see that the impact of the fraction of non-compliant individuals is non-linear close to the epidemic threshold. At low values of Y, i.e., in a population with high compliance to recommendations, closing more gatherings is always beneficial. At the opposite end, for high values of Y, keeping all gatherings open is the optimal intervention. However, at medium values of Y, while closing all gatherings is still the optimal intervention, keeping all gatherings open is better than partial closures. The right-hand panels show the effects of changing intervention time across ranges of Y. The black curve depicts the course of the outbreak without any intervention. The various colored curves peeling off from the black curve show the course of the outbreak given differently timed interventions. Colored dots indicate epidemic peaks larger than the no intervention baseline scenario. Intuitively, we find that earlier interventions are always better and that delayed and imperfect interventions can cause second epidemic waves

