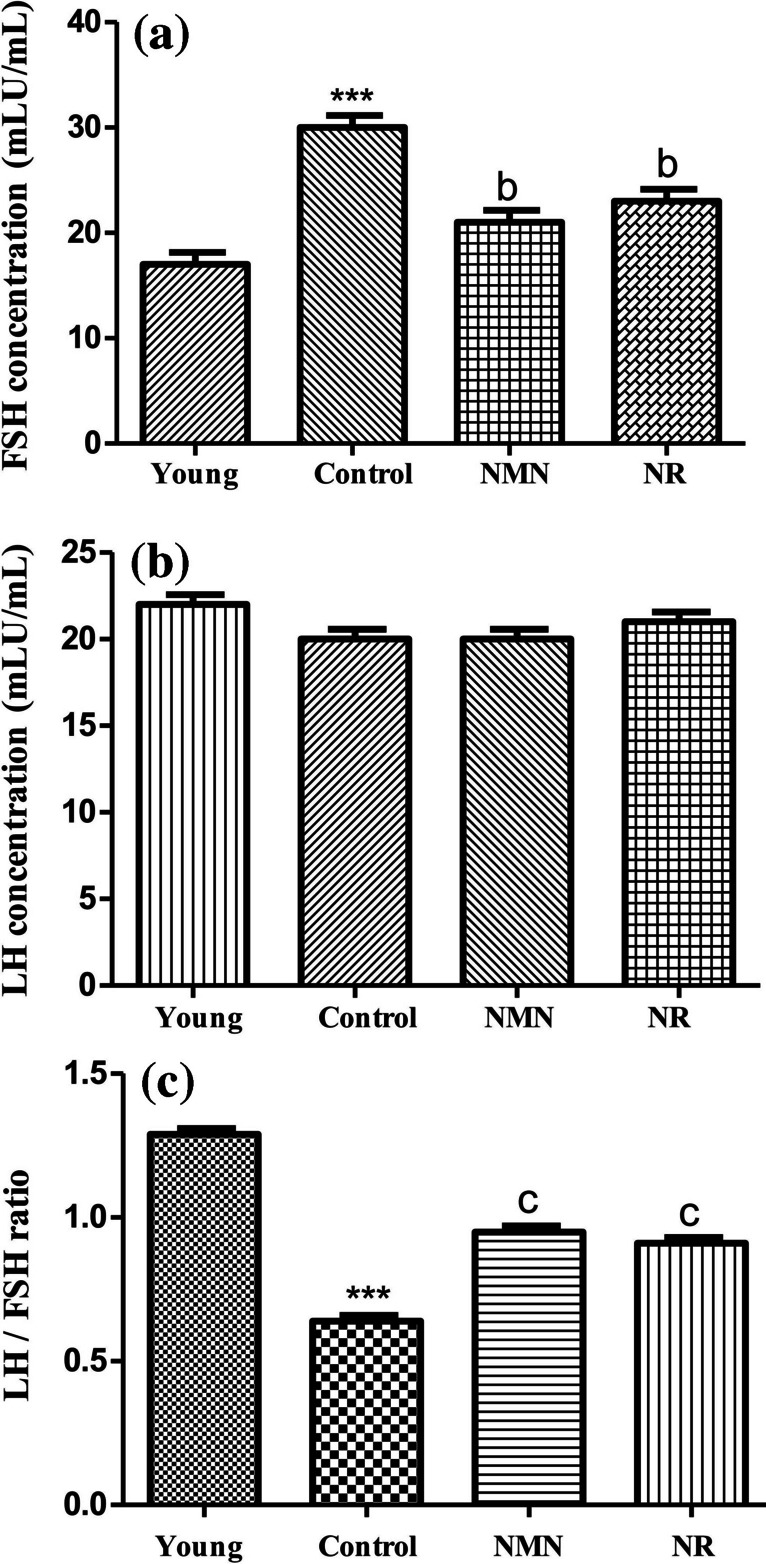
Fig. 1.

Variation of FSH and LH ratios in experimental groups. Analyses were performed on day 18. Data were calculated as mean ± standard deviation. *** p < 0.001 vs young, b p < 0.01 vs control and c p < 0.001 vs control (a p < 0.05, b p < 0.01, c p < 0.001 and n = 3). Young group included 5 months-rats. Control, NMN and NR groups included middle-aged rats (12 months). Phosphate-buffered saline (PBS) was injected or orally given to the control group. NMN prepared in PBS was administered intraperitoneally at 500 mg/kg concentration (middle-aged NMN group) and NR was administered orally at 200 mg/kg concentration by gavage (middle-aged NMN group). Both NMN and NR was applied for 17 days (total of 17 doses
