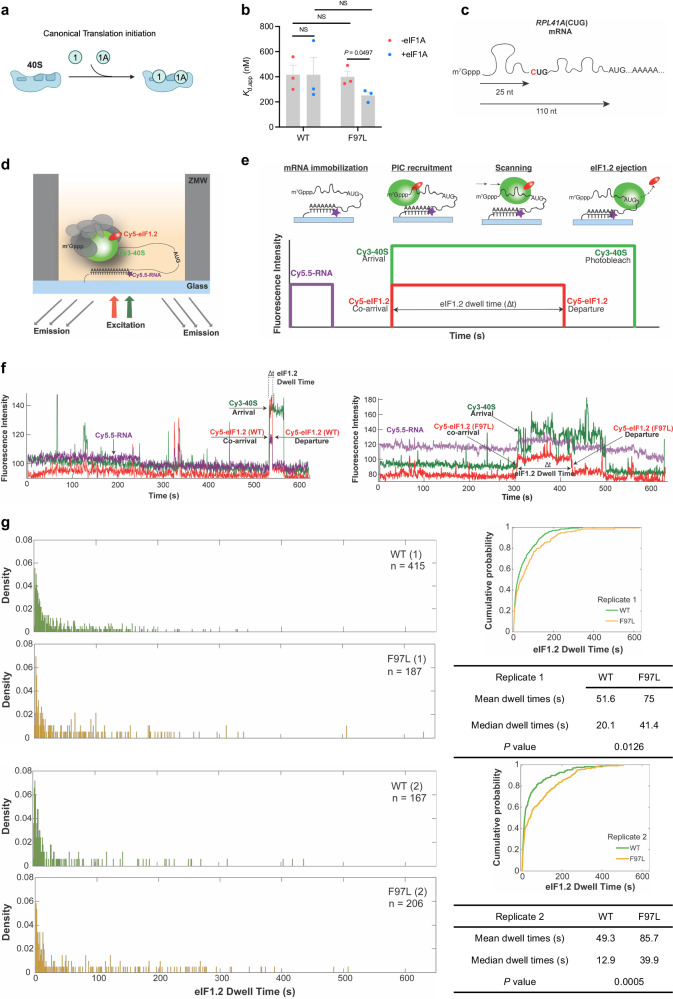
Fig. 3. eIF1.2 F97L affects the scanning dynamics of preinitiation complex.
a Model illustrating eIF1 and eIF1A binding to 40 S ribosome subunit during translation initiation. b Gel shift assay quantification. , or the apparent equilibrium dissociation constant, measures the strength of the interaction between T. gondii eIF1.2 (WT or F97L) and the yeast 40 S subunit, with and without yeast eIF1A. P-values were calculated using Student’s two-tailed t-test. NS, not significant (P > 0.05). Mean ± s.e.m for 3 biological repeats. c Generation of the RPL41A(CUG) mRNA by mutating the 5’ proximal AUG site to CUG. d Schematic for single-molecule fluorescence experiments. Reconstituted chimeric PICs containing T. gondii Cy5-eIF1.2 (WT or F97L), yeast Cy3-40S, unlabeled yeast eIFs 1 A, 2, 3, 4 A, 4B, 4 G, 4E, 5, tRNA-Met, ATP, and GTP were pre-assembled and delivered to immobilized Cy5.5-RPL41A mRNA. ZMWs were illuminated with red and green lasers and the resulting fluorescence was collected and analyzed. e Cy5.5-mRNA fluorescence (purple) at the start of the movie, and terminated by a single photobleaching event, indicates a single mRNA is immobilized on the ZMW surface. mRNA recruitment of Cy5-eIF1.2/Cy3-40S PICs results in simultaneous appearance of green (40 S) and red (eIF1.2) fluorescence. The PIC then scans the mRNA until it locates an initiation site, corresponding to the time interval with sustained, continuous green and red fluorescence (denoted by an arrow). PIC mRNA start-site location triggers rapid eIF1.2 ejection, reflected by loss of red (eIF1.2) fluorescence with retention of green (40 S) fluorescence. The interval (“dwell time”) between co-appearance of Cy3/Cy5 signals and loss of Cy5-eIF1.2 fluorescence is quantified across at least 100 molecules, to generate a dwell-time distribution for each experimental condition. f Representative traces of dwell times for WT and F97L eIF1.2. g Comparison of dwell time distributions, cumulative distributions, and summary (mean, median, P-value) for T. gondii WT and F97L eIF1.2 on RPL41A(CUG) mRNA. 2 biological replicates were performed. n in the distribution plots represents the total number of scanning events which equals to number of molecules. P values were calculated by Wilcoxon rank-sum two-sided test. Source data are provided as a Source Data file.

