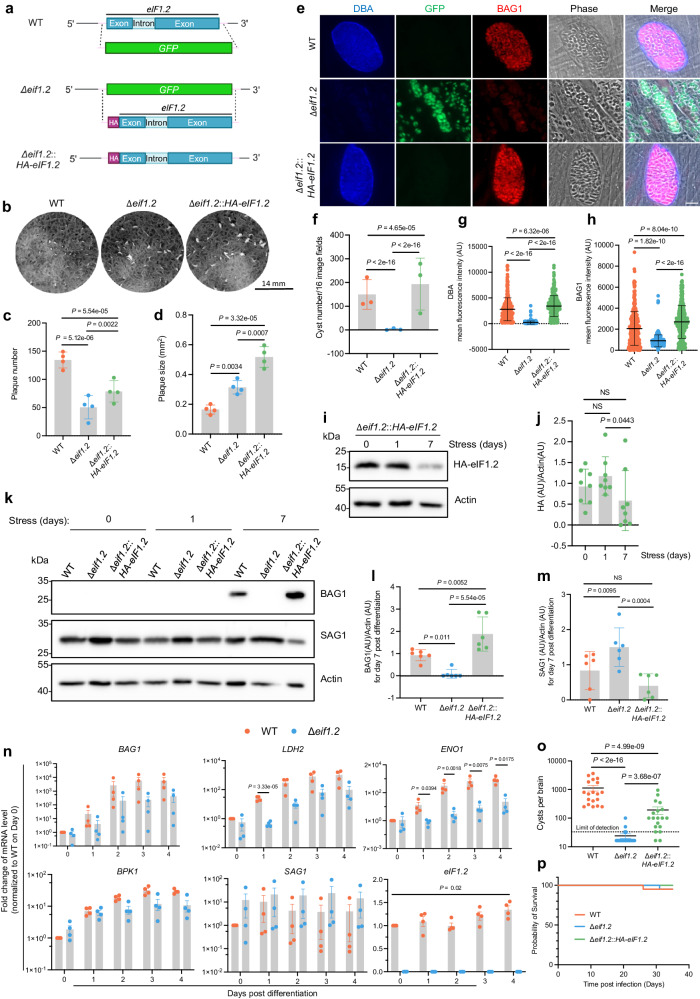
Fig. 4. eIF1.2 is essential for tachyzoite growth and bradyzoite formation.
a Generation of ∆eif1.2 and HA-eIF1.2 complemented strains. b Plaque assays. c, d Quantification of b. Mean ± s.d. for 4 biological replicates. P value was calculated using a linear mixed model. e Representative immunofluorescence images of parasites exposed for 7 days to alkaline stress. Bar, 10 µm. f In vitro cysts count. Mean ± s.d. for 3 biological replicates; A Poisson model was used to calculate P-value. g, h Quantification of mean fluorescence intensity for DBA and BAG1 within individual vacuoles. AU, arbitrary units. Mean ± s.d. for 3 biological replicates. A minimum of 100 vacuoles were quantified for each condition within each replicate. Data were analyzed with a linear regression model. i–m Western blot analysis of parasites exposed for 0, 1 and 7 days to alkaline stress. Actin, loading control. j, l m Quantification of western blot results. Data represent mean ± s.d. The HA-eIF1.2/Actin ratios were from 8 biological replicates and analyzed using a linear regression model. The BAG1/Actin or SAG1/Actin ratios were calculated from 6 biological replicates and analyzed using a linear mixed model. NS, not significant (P > 0.05). n qRT-PCR analysis of parasites exposed to alkaline stress for various days. TUB1, loading control. BAG1, LDH2, ENO1 and BPK1 are bradyzoite-specific markers. SAG1, tachyzoite-specific marker. Mean ± s.e.m. for 4 biological replicates. eIF1.2: linear scale, other genes: logarithmic scale. P values for a specific day were calculated using Welch’s two-tailed t-test combined with a Bonferroni correction. o Brain cyst burden in mice at 5 weeks post-infection. The detection limit is 33 cysts per brain. Brain tissue samples with undetected cysts were assigned 16.5 cysts per brain, half the detection limit. Data represent mean ± s.e.m. Total number of mice analyzed: WT (n = 19), ∆eif1.2 (n = 20), ∆eif1.2::HA-eif1.2 (n = 19). P-value was calculated using a linear regression model. p Survival curve of infected mice. n = 20 mice for each group. Mantel-Cox two-sided test revealed no significant differences among the 3 infected groups. Source data are provided as a Source Data file.

