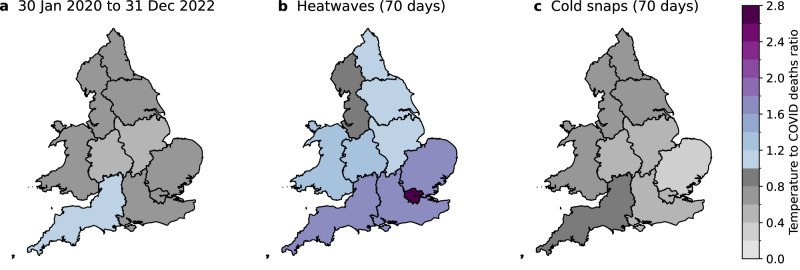
Fig. 2. Maps of the ratio of temperature-related deaths to COVID-19 deaths during extreme temperature events.
Panel a shows regional ratios for the whole study period, i.e., 30 January 2020 to 31 December 2022. Panel b shows regional ratios on 70 heatwave days (in a total of 10 heatwaves) during the study period. Heatwaves are defined following the UKHSA definition. Panel c shows regional ratios on 70 cold snap days (in a total of 8 cold snaps) during the study period. Cold snaps are defined as days on which a Level 3 Cold Health Alert was issued for any region in England.

