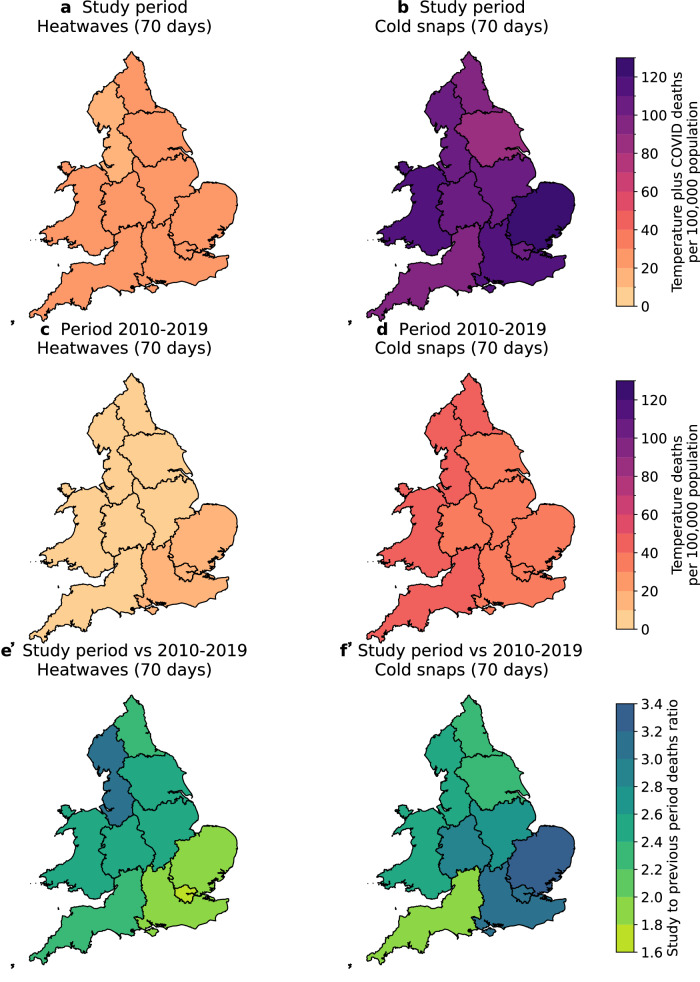
Fig. 3. Maps of the total number of deaths per 100,000 population from non-optimal temperatures and COVID-19 during extreme temperature events, and the comparison of these number before and during the study period.
Panels (a) and (b) show regional sums of temperature-related and COVID-19 deaths on 70 heatwave days (in a total of 10 heatwaves; panel (a)) and 70 cold snap days (in a total of 8 cold snaps; panel (b)), during the study period of 30 January 2020 to 31 December 2022. Panels (c) and (d) show regional numbers of temperature-related deaths on the same number of heatwaves (panel (c)) and cold snap days (panel (d)) but from the period 2010–2019. The numbers in panels c and d are estimated from the average number of temperature-related deaths per heatwave or cold snap day in the period 2010–2019, multiplied by 70 days. Panels (e) and (f) show regional ratios of deaths during the study period to the 2010–2019 period for heatwaves (panel (e)) and cold snaps (panel (f)).

