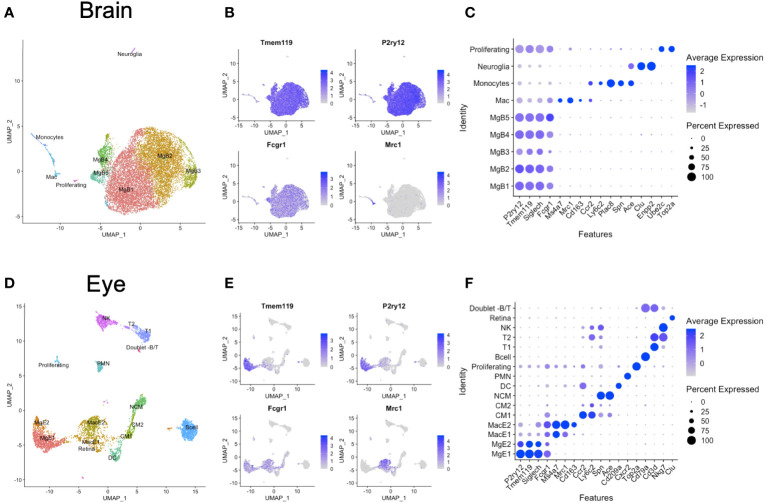
Figure 1.
Unintegrated scRNA-seq analysis of brain and eye CD45+ immune cells. (A) Dimensionality reduction with uniform manifold approximation and projection (UMAP) for the brain. (B) Canonical marker genes are displayed for brain microglia and macrophage clusters in feature plots. (C) Canonical marker genes are displayed for each cellular cluster in the brain in a dot plot. (D) Dimensionality reduction with UMAP for the eye. (E) Canonical marker genes are displayed for eye microglia and macrophage clusters in feature plots. (F) Canonical marker genes are displayed for each cellular cluster in the eye in a dot plot. Mg, microglia; Mac, macrophage; CM, classical monocyte; NCM, nonclassical monocyte; DC, dendritic cell; PMN, polymorphonuclear neutrophil; NK cell, natural killer cell.

